Tyson Foods 2011 Annual Report Download - page 70
Download and view the complete annual report
Please find page 70 of the 2011 Tyson Foods annual report below. You can navigate through the pages in the report by either clicking on the pages listed below, or by using the keyword search tool below to find specific information within the annual report.-
 1
1 -
2
-
3
-
4
-
5
-
6
-
7
-
8
-
9
-
10
-
11
-
12
-
13
-
14
-
15
-
16
-
17
-
18
-
19
-
20
-
21
-
22
-
23
-
24
-
25
-
26
-
27
-
28
-
29
-
30
-
31
-
32
-
33
-
34
-
35
-
36
-
37
-
38
-
39
-
40
-
41
-
42
-
43
-
44
-
45
-
46
-
47
-
48
-
49
-
50
-
51
-
52
-
53
-
54
-
55
-
56
-
57
-
58
-
59
-
 60
60 -
 61
61 -
 62
62 -
 63
63 -
 64
64 -
 65
65 -
 66
66 -
 67
67 -
 68
68 -
 69
69 -
 70
70 -
 71
71 -
 72
72 -
 73
73 -
 74
74 -
 75
75 -
 76
76 -
 77
77 -
 78
78 -
 79
79 -
 80
80 -
81
-
82
-
83
-
84
-
85
-
86
-
87
-
88
-
89
-
90
-
91
-
92
 |
 |

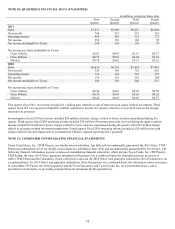
70
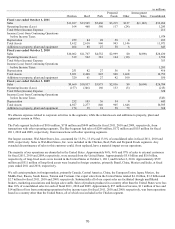
in millions
Chicken
Beef
Pork
Prepared
Foods
Other
Intersegment
Sales
Consolidated
Fiscal year ended October 1, 2011
Sales
$11,017
$13,549
$5,460
$3,215
$127
$(1,102)
$32,266
Operating Income (Loss)
164
468
560
117
(24)
1,285
Total Other (Income) Expense
211
Income (Loss) from Continuing Operations
before Income Taxes
1,074
Depreciation
259
84
28
58
4
433
Total Assets
5,412
2,610
960
943
1,146
11,071
Additions to property, plant and equipment
464
88
27
58
6
643
Fiscal year ended October 2, 2010
Sales
$10,062
$11,707
$4,552
$2,999
$0
$(890)
$28,430
Operating Income (Loss)
519
542
381
124
(10)
1,556
Total Other (Income) Expense
353
Income (Loss) from Continuing Operations
before Income Taxes
1,203
Depreciation
251
82
27
56
0
416
Total Assets
5,031
2,468
845
940
1,468
l0,752
Additions to property, plant and equipment
320
61
27
42
100
550
Fiscal year ended October 3, 2009
Sales
$9,660
$10,937
$3,875
$2,836
$0
$(604)
$26,704
Operating Income (Loss)
(157)
(346)
160
133
(5)
(215)
Total Other (Income) Expense
328
Income (Loss) from Continuing Operations
before Income Taxes
(543)
Depreciation
252
103
36
54
0
445
Total Assets
4,927
2,277
840
905
1,646
l0,595
Additions to property, plant and equipment
174
39
18
58
79
368
We allocate expenses related to corporate activities to the segments, while the related assets and additions to property, plant and
equipment remain in Other.
The Pork segment had sales of $816 million, $718 million and $449 million for fiscal 2011, 2010 and 2009, respectively, from
transactions with other operating segments. The Beef segment had sales of $286 million, $172 million and $155 million for fiscal
2011, 2010 and 2009, respectively, from transactions with other operating segments.
Our largest customer, Wal-Mart Stores, Inc., accounted for 13.3%, 13.4% and 13.8% of consolidated sales in fiscal 2011, 2010 and
2009, respectively. Sales to Wal-Mart Stores, Inc. were included in the Chicken, Beef, Pork and Prepared Foods segments. Any
extended discontinuance of sales to this customer could, if not replaced, have a material impact on our operations.
The majority of our operations are domiciled in the United States. Approximately 96%, 96% and 97% of sales to external customers
for fiscal 2011, 2010 and 2009, respectively, were sourced from the United States. Approximately $5.8 billion and $5.6 billion,
respectively, of long-lived assets were located in the United States at October 1, 2011, and October 2, 2010. Approximately $539
million and $511 million of long-lived assets were located in foreign countries, primarily Brazil, China, Mexico and India, at fiscal
years ended 2011 and 2010, respectively.
We sell certain products in foreign markets, primarily Canada, Central America, China, the European Union, Japan, Mexico, the
Middle East, Russia, South Korea, Taiwan and Vietnam. Our export sales from the United States totaled $4.1 billion, $3.2 billion and
$2.7 billion for fiscal 2011, 2010 and 2009, respectively. Substantially all of our export sales are facilitated through unaffiliated
brokers, marketing associations and foreign sales staffs. Sales of products produced in a country other than the United States were less
than 10% of consolidated sales for each of fiscal 2011, 2010 and 2009. Approximately $57 million of income, $11 million of loss and
$14 million of loss from continuing operations before income taxes for fiscal 2011, 2010 and 2009, respectively, was from operations
based in a country other than the United States, all of which was included in the Chicken segment.