Tyson Foods 2011 Annual Report Download - page 20
Download and view the complete annual report
Please find page 20 of the 2011 Tyson Foods annual report below. You can navigate through the pages in the report by either clicking on the pages listed below, or by using the keyword search tool below to find specific information within the annual report.-
 1
1 -
2
-
3
-
4
-
5
-
6
-
7
-
8
-
9
-
 10
10 -
 11
11 -
 12
12 -
 13
13 -
 14
14 -
 15
15 -
 16
16 -
 17
17 -
 18
18 -
 19
19 -
 20
20 -
 21
21 -
 22
22 -
 23
23 -
 24
24 -
 25
25 -
 26
26 -
 27
27 -
 28
28 -
 29
29 -
 30
30 -
31
-
32
-
33
-
34
-
35
-
36
-
37
-
38
-
39
-
40
-
41
-
42
-
43
-
44
-
45
-
46
-
47
-
48
-
49
-
50
-
51
-
52
-
53
-
54
-
55
-
56
-
57
-
58
-
59
-
60
-
61
-
62
-
63
-
64
-
65
-
66
-
67
-
68
-
69
-
70
-
71
-
72
-
73
-
74
-
75
-
76
-
77
-
78
-
79
-
80
-
81
-
82
-
83
-
84
-
85
-
86
-
87
-
88
-
89
-
90
-
91
-
92
 |
 |

20
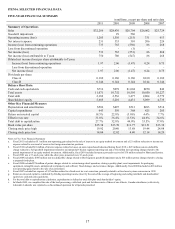
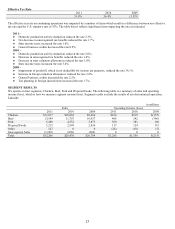
SUMMARY OF RESULTS – CONTINUING OPERATIONS
Sales
in millions
2011
2010
2009
Sales
$32,266
$28,430
$26,704
Change in sales volume
1.7%
(0.6)%
Change in average sales price
11.8%
7.1%
Sales growth
13.5%
6.5%
2011 vs. 2010 –
●
Average Sales Price – The increase in sales was largely due to an increase in average sales prices, which accounted for
an increase of approximately $
3.4 billion. While all segments had an increase in average sales prices
mostly due to price
increases associated with rising raw material costs
, the majority of the increase was driven by the Beef and Pork
segments.
●
Sales Volume – Sales were positively impacted by an increase in sales volume, which accounted for an increase of $484
million. This was primarily due to
increases in the Chicken
and Pork segments, partially offset by decreases in the Beef
and Prepared Foods segments.
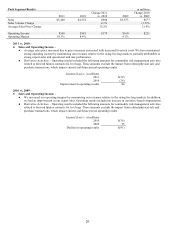
2010 vs. 2009 –
●
Average Sales Price – The increase in sales was largely due to an increase in average sales prices, which accounted for
an increase of approximately $1.9 billion. While all segments had an increase in average sales prices, the majority of the
increase was driven by the Beef and Pork segments.
●
Sales Volume – Sales were negatively impacted by a decrease in sales volume, which accounted for a decrease of $150
million. This was primarily due to an extra week in fiscal 2009 and the decrease in Pork segment sales volume, partially
offset by an increase from a fiscal 2009 acquisition in the Chicken segment.
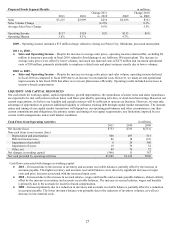
Cost of Sales
in millions
2011
2010
2009
Cost of sales
$30,067
$25,916
$25,501
Gross profit
$2,199
$2,514
$1,203
Cost of sales as a percentage of sales
93.2%
91.2%
95.5%
2011 vs. 2010 –
●
Cost of sales increased by approximately $4.1 billion. Higher input cost per pound increased cost of sales by
approximately $3.7 billion, while higher sales volume increased cost of sales $445 million.
●
The $3.7 billion impact of higher input costs per pound was primarily driven by:
●
Increase in average live cattle and hog costs of approximately $2.4 billion.
●
Increase in grain and feed ingredients of $675 million and increase in other growout operating costs of $74 million in
our Chicken segment, which were partially offset by approximately $200 million of operational improvements.
●
Increase in raw material costs of $273 million in our Prepared Foods segment.
●
The $0.4 billion impact of higher sales volumes was primarily driven by:
●
Increases in sales volume in our Chicken and Pork segments partially offset by decreases in our Beef and Prepared
Foods segments.
●
Increase of $145 million of costs of sales associated with Dynamic Fuels, which commenced production activities in
fiscal 2011.
2010 vs. 2009 –
●
Cost of sales increased $415 million. Higher cost per pound increased cost of sales by $558 million, partially offset by
lower sales volume which decreased cost of sales by $143 million.
●
Increase in average live cattle and hog costs of approximately $1.0 billion.
●
Increase due to net losses of $78 million in fiscal 2010, as compared to net gains of $191 million in fiscal 2009, from
our commodity risk management activities related to forward futures contracts for live cattle and hogs, and excludes
the impact from related physical purchase transactions which impact current and future period operating results.
●
Increase in raw material costs of approximately $218 million in our Prepared Foods segment.
●
Increase in incentive-based compensation of approximately $97 million.
●
Decrease due to net losses of $6 million in fiscal 2010, as compared to net losses of $257 million in fiscal 2009, from
our commodity risk management activities related to grain and energy purchases, and excludes the impact from related
physical purchase transactions which impact current and future period operating results.
●
Decrease in grain costs in the Chicken segment of approximately $158 million.
●
Decrease in the Chicken segment costs resulting from operational improvements.