Tyson Foods 2011 Annual Report Download - page 40
Download and view the complete annual report
Please find page 40 of the 2011 Tyson Foods annual report below. You can navigate through the pages in the report by either clicking on the pages listed below, or by using the keyword search tool below to find specific information within the annual report.-
 1
1 -
2
-
3
-
4
-
5
-
6
-
7
-
8
-
9
-
10
-
11
-
12
-
13
-
14
-
15
-
16
-
17
-
18
-
19
-
20
-
21
-
22
-
23
-
24
-
25
-
26
-
27
-
28
-
29
-
 30
30 -
 31
31 -
 32
32 -
 33
33 -
 34
34 -
 35
35 -
 36
36 -
 37
37 -
 38
38 -
 39
39 -
 40
40 -
 41
41 -
 42
42 -
 43
43 -
 44
44 -
 45
45 -
 46
46 -
 47
47 -
 48
48 -
 49
49 -
 50
50 -
51
-
52
-
53
-
54
-
55
-
56
-
57
-
58
-
59
-
60
-
61
-
62
-
63
-
64
-
65
-
66
-
67
-
68
-
69
-
70
-
71
-
72
-
73
-
74
-
75
-
76
-
77
-
78
-
79
-
80
-
81
-
82
-
83
-
84
-
85
-
86
-
87
-
88
-
89
-
90
-
91
-
92
 |
 |

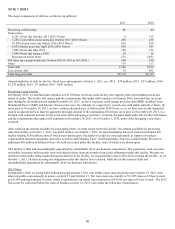
40
TYSON FOODS, INC.
CONSOLIDATED BALANCE SHEETS
October 1, 2011, and October 2, 2010
in millions, except share and per share data
2011
2010
Assets
Current Assets:
Cash and cash equivalents
$716
$978
Accounts receivable, net
1,321
1,198
Inventories
2,587
2,274
Other current assets
156
168
Total Current Assets
4,780
4,618
Net Property, Plant and Equipment
3,823
3,674
Goodwill
1,892
1,893
Intangible Assets
149
166
Other Assets
427
401
Total Assets
$11,071
$10,752
Liabilities and Shareholders’ Equity
Current Liabilities:
Current debt
$70
$401
Accounts payable
1,264
1,110
Other current liabilities
1,040
1,034
Total Current Liabilities
2,374
2,545
Long-Term Debt
2,112
2,135
Deferred Income Taxes
424
321
Other Liabilities
476
486
Redeemable Noncontrolling Interest
0
64
Shareholders’ Equity:
Common stock ($0.10 par value):
Class A-authorized 900 million shares:
issued 322 million shares in both 2011 and 2010
32
32
Convertible Class B-authorized 900 million shares:
issued 70 million shares in both 2011 and 2010
7
7
Capital in excess of par value
2,261
2,243
Retained earnings
3,801
3,113
Accumulated other comprehensive income (loss)
(79)
0
Treasury stock, at cost –
22 million shares in 2011 and 15 million shares in 2010
(365)
(229)
Total Tyson Shareholders’ Equity
5,657
5,166
Noncontrolling Interest
28
35
Total Shareholders’ Equity
5,685
5,201
Total Liabilities and Shareholders’ Equity
$11,071
$10,752
See accompanying notes.