Tyson Foods 2011 Annual Report Download - page 78
Download and view the complete annual report
Please find page 78 of the 2011 Tyson Foods annual report below. You can navigate through the pages in the report by either clicking on the pages listed below, or by using the keyword search tool below to find specific information within the annual report.-
 1
1 -
2
-
3
-
4
-
5
-
6
-
7
-
8
-
9
-
10
-
11
-
12
-
13
-
14
-
15
-
16
-
17
-
18
-
19
-
20
-
21
-
22
-
23
-
24
-
25
-
26
-
27
-
28
-
29
-
30
-
31
-
32
-
33
-
34
-
35
-
36
-
37
-
38
-
39
-
40
-
41
-
42
-
43
-
44
-
45
-
46
-
47
-
48
-
49
-
50
-
51
-
52
-
53
-
54
-
55
-
56
-
57
-
58
-
59
-
60
-
61
-
62
-
63
-
64
-
65
-
66
-
67
-
 68
68 -
 69
69 -
 70
70 -
 71
71 -
 72
72 -
 73
73 -
 74
74 -
 75
75 -
 76
76 -
 77
77 -
 78
78 -
 79
79 -
 80
80 -
 81
81 -
 82
82 -
 83
83 -
 84
84 -
 85
85 -
 86
86 -
 87
87 -
 88
88 -
89
-
90
-
91
-
92
 |
 |
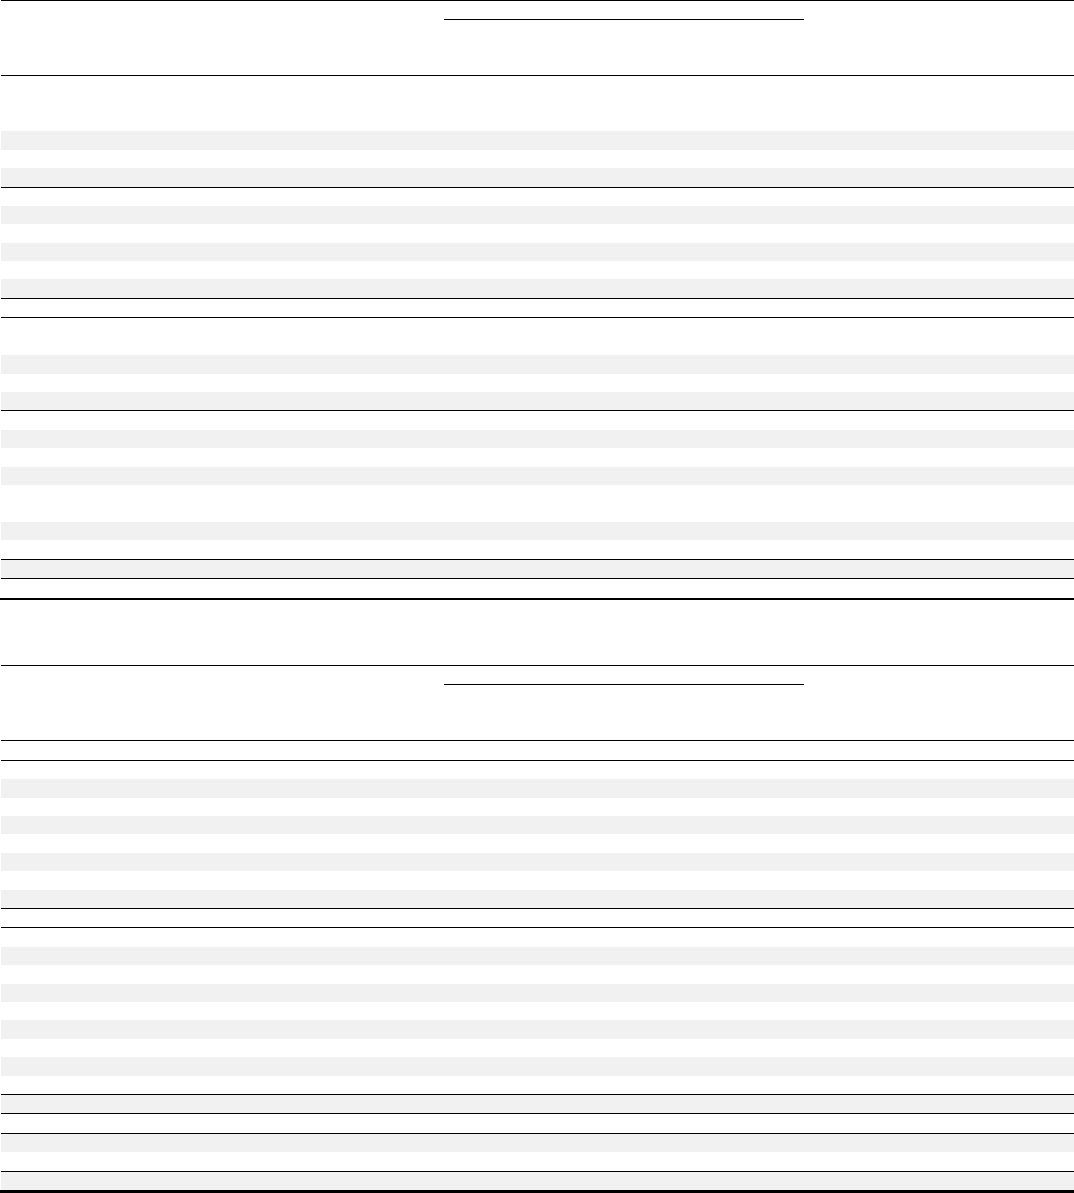
78
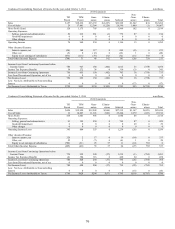
Condensed Consolidating Balance Sheet as of October 2, 2010
in millions
2014 Guarantors
TFI
Parent
TFM
Parent
Guar-
antors
Elimin-
ations
Subtotal
Non-
Guar-
antors
Elimin-
ations
Total
Assets
Current Assets:
Cash and cash equivalents
$2
$2
$731
$0
$733
$243
$0
$978
Accounts receivable, net
0
2,389
4,670
0
7,059
132
(5,993)
1,198
Inventories
0
734
1,361
0
2,095
179
0
2,274
Other current assets
43
49
27
(9)
67
95
(37)
168
Total Current Assets
45
3,174
6,789
(9)
9,954
649
(6,030)
4,618
Net Property, Plant and Equipment
39
870
2,257
0
3,127
508
0
3,674
Goodwill
0
880
967
0
1,847
46
0
1,893
Intangible Assets
0
37
53
0
90
76
0
166
Other Assets
2,804
101
61
0
162
295
(2,860)
401
Investment in Subsidiaries
10,776
1,785
631
(1,607)
809
307
(11,892)
0
Total Assets
$13,664
$6,847
$10,758
$(1,616)
$15,989
$1,881
$(20,782)
$10,752
Liabilities and Shareholders’ Equity
Current Liabilities:
Current debt
$317
$0
$0
$0
$0
$84
$0
$401
Accounts payable
16
421
608
0
1,029
65
0
1,110
Other current liabilities
6,044
168
335
(9)
494
526
(6,030)
1,034
Total Current Liabilities
6,377
589
943
(9)
1,523
675
(6,030)
2,545
Long-Term Debt
2,011
1,638
1,228
0
2,866
118
(2,860)
2,135
Deferred Income Taxes
0
105
204
0
309
12
0
321
Other Liabilities
110
148
179
0
327
49
0
486
Redeemable Noncontrolling Interest
0
0
0
0
0
64
0
64
Total Tyson Shareholders’ Equity
5,166
4,367
8,204
(1,607)
10,964
928
(11,892)
5,166
Noncontrolling Interest
0
0
0
0
0
35
0
35
Total Shareholders’ Equity
5,166
4,367
8,204
(1,607)
10,964
963
(11,892)
5,201
Total Liabilities and Shareholders’ Equity
$13,664
$6,847
$10,758
$(1,616)
$15,989
$1,881
$(20,782)
$10,752
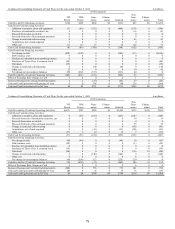
Condensed Consolidating Statement of Cash Flows for the year ended October 1, 2011
in millions
2014 Guarantors
TFI
Parent
TFM
Parent
Guar-
antors
Elimin-
ations
Subtotal
Non-
Guar-
antors
Elimin-
ations
Total
Cash Provided by (Used for) Operating Activities
$31
$564
$468
$0
$1,032
$3
$(20)
$1,046
Cash Flows From Investing Activities:
Additions to property, plant and equipment
(1)
(107)
(443)
0
(550)
(92)
0
(643)
Purchases of marketable securities, net
0
(57)
(21)
0
(78)
(2)
0
(80)
Proceeds from notes receivable
0
0
0
0
0
51
0
51
Proceeds from sale of discontinued operation
0
0
0
0
0
0
0
0
Change in restricted cash-investing
0
0
0
0
0
0
0
0
Acquisitions, net of cash acquired
0
0
0
0
0
0
0
0
Other, net
23
0
8
0
8
(3)
0
28
Cash Provided by (Used for) Investing Activities
22
(164)
(456)
0
(620)
(46)
0
(644)
Cash Flows from Financing Activities:
Net change in debt
(391)
(6)
0
0
(6)
12
0
(385)
Debt issuance costs
(9)
0
0
0
0
0
0
(9)
Purchase of redeemable noncontrolling interest
0
0
0
0
0
(66)
0
(66)
Purchases of Tyson Class A common stock
(207)
0
0
0
0
0
0
(207)
Dividends
(59)
0
0
0
0
(20)
20
(59)
Change in restricted cash-financing
0
0
0
0
0
0
0
0
Other, net
58
0
0
0
0
10
0
68
Net change in intercompany balances
554
(395)
(329)
0
(724)
170
0
0
Cash Provided by (Used for) Financing Activities
(54)
(401)
(329)
0
(730)
106
20
(658)
Effect of Exchange Rate Change on Cash
0
0
0
0
0
(6)
0
(6)
Increase (Decrease) in Cash and Cash Equivalents
(1)
(1)
(317)
0
(318)
57
0
(262)
Cash and Cash Equivalents at Beginning of Year
2
2
731
0
733
243
0
978
Cash and Cash Equivalents at End of Year
$1
$1
$414
$0
$415
$300
$0
$716