Tyson Foods 2011 Annual Report Download - page 18
Download and view the complete annual report
Please find page 18 of the 2011 Tyson Foods annual report below. You can navigate through the pages in the report by either clicking on the pages listed below, or by using the keyword search tool below to find specific information within the annual report.-
 1
1 -
2
-
3
-
4
-
5
-
6
-
7
-
 8
8 -
 9
9 -
 10
10 -
 11
11 -
 12
12 -
 13
13 -
 14
14 -
 15
15 -
 16
16 -
 17
17 -
 18
18 -
 19
19 -
 20
20 -
 21
21 -
 22
22 -
 23
23 -
 24
24 -
 25
25 -
 26
26 -
 27
27 -
 28
28 -
29
-
30
-
31
-
32
-
33
-
34
-
35
-
36
-
37
-
38
-
39
-
40
-
41
-
42
-
43
-
44
-
45
-
46
-
47
-
48
-
49
-
50
-
51
-
52
-
53
-
54
-
55
-
56
-
57
-
58
-
59
-
60
-
61
-
62
-
63
-
64
-
65
-
66
-
67
-
68
-
69
-
70
-
71
-
72
-
73
-
74
-
75
-
76
-
77
-
78
-
79
-
80
-
81
-
82
-
83
-
84
-
85
-
86
-
87
-
88
-
89
-
90
-
91
-
92
 |
 |
18
ITEM 7. MANAGEMENT’S DISCUSSION AND ANALYSIS OF FINANCIAL CONDITION AND RESULTS OF
OPERATIONS
DESCRIPTION OF THE COMPANY
We are one of the world’s largest meat protein companies and the second-largest food production company in the Fortune 500 with
one of the most recognized brand names in the food industry. We produce, distribute and market chicken, beef, pork, prepared foods
and related allied products. Our operations are conducted in four segments: Chicken, Beef, Pork and Prepared Foods. Some of the key
factors influencing our business are customer demand for our products; the ability to maintain and grow relationships with customers
and introduce new and innovative products to the marketplace; accessibility of international markets; market prices for our products;
the cost of live cattle and hogs, raw materials, grain and feed ingredients; and operating efficiencies of our facilities.
OVERVIEW
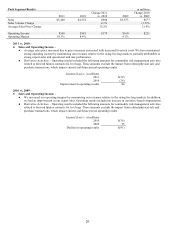
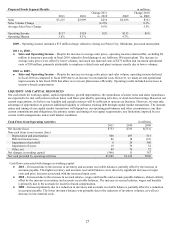
●
General – As a result of improved internal performance, strong exports and favorable market conditions in our Beef
and Pork segments, our operating results remained strong in fiscal 2011 despite a $3.7 billion increase in input costs.
The following are a few of the key drivers:
●
We continued to focus on maximizing our margins through margin management and operational efficiency
improvements. Margin management improvements occurred in the areas of mix, export sales, price optimization
and value-added products initiatives. The operational efficiencies occurred in the areas of yields, cost reduction,
labor management and logistics cost optimization.
●
Strong demand and exports in the Beef and Pork segments created a favorable pricing environment. While our
Chicken segment remained profitable in fiscal 2011, we were challenged by $675 million in increased grain and
other feed ingredients costs, as well as excess industry supplies, which made it difficult to pass along the
increased input costs. As a result of balancing our supply with customer demand, we cut production after
customer demand fell short of expectations. Recent USDA data indicates decreased egg sets, broiler chick
placements and slaughter pounds. However, the impact of these production cuts, and the associated impact on
market prices, did not begin to materialize until late fourth quarter and into fiscal 2012.
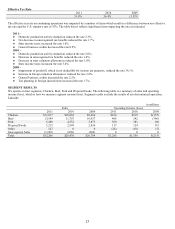
●
With an operating margin of 4.0% in fiscal 2011, we have achieved operating margins of 4.0% or better in
consecutive years for the first time since the acquisition of IBP, inc. in 2001. The following is a summary of operating
margins by segment:
●
Chicken – 1.5%
●
Beef – 3.5%
●
Pork – 10.3%
●
Prepared Foods – 3.6%
●
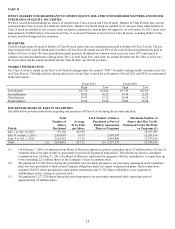
Debt and Liquidity – During fiscal 2011, we generated $1.0 billion of operating cash flows. Total debt declined $350
million in fiscal 2011 to $2.2 billion, the lowest level since the acquisition of IBP, inc. Additionally, we repurchased,
as part of our previously announced share repurchase program, 9.7 million shares of our stock for $170 million in
fiscal 2011. At October 1, 2011, we had $1.6 billion of liquidity, which includes the availability under our credit
facility and $716 million of cash and cash equivalents.
●
Our accounting cycle resulted in a 52-week year for both fiscal 2011 and 2010 and a 53-week year for fiscal 2009.