Tyson Foods 2011 Annual Report Download - page 21
Download and view the complete annual report
Please find page 21 of the 2011 Tyson Foods annual report below. You can navigate through the pages in the report by either clicking on the pages listed below, or by using the keyword search tool below to find specific information within the annual report.-
 1
1 -
2
-
3
-
4
-
5
-
6
-
7
-
8
-
9
-
10
-
 11
11 -
 12
12 -
 13
13 -
 14
14 -
 15
15 -
 16
16 -
 17
17 -
 18
18 -
 19
19 -
 20
20 -
 21
21 -
 22
22 -
 23
23 -
 24
24 -
 25
25 -
 26
26 -
 27
27 -
 28
28 -
 29
29 -
 30
30 -
 31
31 -
32
-
33
-
34
-
35
-
36
-
37
-
38
-
39
-
40
-
41
-
42
-
43
-
44
-
45
-
46
-
47
-
48
-
49
-
50
-
51
-
52
-
53
-
54
-
55
-
56
-
57
-
58
-
59
-
60
-
61
-
62
-
63
-
64
-
65
-
66
-
67
-
68
-
69
-
70
-
71
-
72
-
73
-
74
-
75
-
76
-
77
-
78
-
79
-
80
-
81
-
82
-
83
-
84
-
85
-
86
-
87
-
88
-
89
-
90
-
91
-
92
 |
 |

21
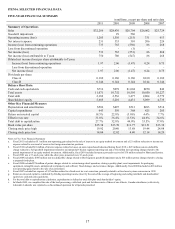
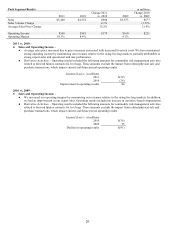
Selling, General and Administrative
in millions
2011
2010
2009
Selling, general and administrative
$914
$929
$841
As a percentage of sales
2.8%
3.3%
3.1%
2011 vs. 2010 –
●
Decrease of $13 million related to incentive-based compensation.
2010 vs. 2009 –
●
Increase of $118 million related to incentive-based compensation.
●
Reductions include decreases resulting from one less week in fiscal 2010 compared to fiscal 2009, as well as a $16 million
reduction in professional fees, advertising and sales promotions.
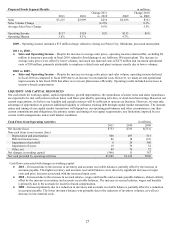
Goodwill Impairment
in millions
2011
2010
2009
$0
$29
$560
We perform our annual goodwill impairment test on the first day of the fourth quarter. We estimate the fair value of our reporting
units using a discounted cash flow analysis. As further discussed in Critical Accounting Estimates, this analysis requires us to
make various judgmental estimates and assumptions about sales, operating margins, growth rates and discount factors.
2010 – Includes the full impairment of an immaterial Chicken segment reporting unit.
2009 – Includes the partial impairment of our Beef segment reporting unit.
Other Charges
in millions
2011
2010
2009
$0
$0
$17
2009 – Included $15 million charge related to closing our Ponca City, Oklahoma, processed meats plant.
Interest Income
in millions
2011
2010
2009
$11
$14
$17
2011/2010/2009 – Declines in interest income are primarily due to declines in cash balances and interest rates. The declines in
cash balances are primarily due to repurchases, retirement and redemption of senior notes, repurchases of Class A common
stock under the reactivated share repurchase program and additions to property, plant and equipment.