Tyson Foods 2011 Annual Report Download - page 22
Download and view the complete annual report
Please find page 22 of the 2011 Tyson Foods annual report below. You can navigate through the pages in the report by either clicking on the pages listed below, or by using the keyword search tool below to find specific information within the annual report.-
 1
1 -
2
-
3
-
4
-
5
-
6
-
7
-
8
-
9
-
10
-
11
-
 12
12 -
 13
13 -
 14
14 -
 15
15 -
 16
16 -
 17
17 -
 18
18 -
 19
19 -
 20
20 -
 21
21 -
 22
22 -
 23
23 -
 24
24 -
 25
25 -
 26
26 -
 27
27 -
 28
28 -
 29
29 -
 30
30 -
 31
31 -
 32
32 -
33
-
34
-
35
-
36
-
37
-
38
-
39
-
40
-
41
-
42
-
43
-
44
-
45
-
46
-
47
-
48
-
49
-
50
-
51
-
52
-
53
-
54
-
55
-
56
-
57
-
58
-
59
-
60
-
61
-
62
-
63
-
64
-
65
-
66
-
67
-
68
-
69
-
70
-
71
-
72
-
73
-
74
-
75
-
76
-
77
-
78
-
79
-
80
-
81
-
82
-
83
-
84
-
85
-
86
-
87
-
88
-
89
-
90
-
91
-
92
 |
 |

22
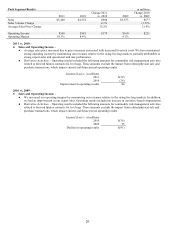
Interest Expense
in millions
2011
2010
2009
Cash interest expense
$195
$245
$270
Losses on notes repurchased
7
61
3
Non-cash interest expense
40
41
54
Total Interest Expense
$242
$347
$327
2011 vs. 2010 –
●
Cash interest expense included interest expense related to the coupon rates for senior notes and commitment/letter of
credit fees incurred on our revolving credit facilities. The decrease is due
primarily
to lower average weekly indebtedness
of approximately 15%.
●
Losses on notes repurchased during fiscal 2011 and 2010 included the amount paid exceeding the carrying value of the
notes repurchased, which primarily included the repurchases of the 8.25% Notes due October 2011 (2011 Notes) and the
6.85% Senior notes due April 2016 (2016 Notes).
●
Non-cash interest expense primarily included interest related to the amortization of debt issuance costs and
discounts/premiums on note issuances. This included debt issuance costs incurred on our revolving credit facility, the
10.50% Senior Notes due 2014 (2014 Notes) issued in March 2009, as well as the accretion of the debt discount on the
3.25% Convertible Senior Notes due 2013 (2013 Notes) and 2014 Notes.
2010 vs. 2009 –
●
Cash interest expense included interest expense related to the coupon rates for senior notes and commitment/letter of
credit fees incurred on our revolving credit facilities. The decrease is due to lower average weekly indebtedness of
approximately 11%, partially offset by an increase in the overall average borrowing rates.
●
Losses on notes repurchased during fiscal 2010 included the amount paid exceeding the carrying value of the notes
repurchased, which primarily included the repurchases of the 2011 Notes and the 2016 Notes.
●
Non-cash interest expense primarily included interest related to the amortization of debt issuance costs and
discounts/premiums on note issuances. This included debt issuance costs incurred on our revolving credit facility, the
2014 Notes, as well as the accretion of the debt discount on the 2013 Notes and 2014 Notes. Fiscal 2009 also includes
expenses related to amendment fees paid in December 2008 on our then existing credit agreements.
Other (Income) Expense, net
in millions
2011
2010
2009
$(20)
$20
$18
2011 – Included $11 million gain related to a sale of interests in an equity method investment.
2010 – Included $12 million charge related to the impairment of an equity method investment.
2009 – Included $24 million in foreign currency exchange loss.