The Hartford 2015 Annual Report Download - page 99
Download and view the complete annual report
Please find page 99 of the 2015 The Hartford annual report below. You can navigate through the pages in the report by either clicking on the pages listed below, or by using the keyword search tool below to find specific information within the annual report.-
 1
1 -
2
-
3
-
4
-
5
-
6
-
7
-
8
-
9
-
10
-
11
-
12
-
13
-
14
-
15
-
16
-
17
-
18
-
19
-
20
-
21
-
22
-
23
-
24
-
25
-
26
-
27
-
28
-
29
-
30
-
31
-
32
-
33
-
34
-
35
-
36
-
37
-
38
-
39
-
40
-
41
-
42
-
43
-
44
-
45
-
46
-
47
-
48
-
49
-
50
-
51
-
52
-
53
-
54
-
55
-
56
-
57
-
58
-
59
-
60
-
61
-
62
-
63
-
64
-
65
-
66
-
67
-
68
-
69
-
70
-
71
-
72
-
73
-
74
-
75
-
76
-
77
-
78
-
79
-
80
-
81
-
82
-
83
-
84
-
85
-
86
-
87
-
88
-
 89
89 -
 90
90 -
 91
91 -
 92
92 -
 93
93 -
 94
94 -
 95
95 -
 96
96 -
 97
97 -
 98
98 -
 99
99 -
 100
100 -
 101
101 -
 102
102 -
 103
103 -
 104
104 -
 105
105 -
 106
106 -
 107
107 -
 108
108 -
 109
109 -
110
-
111
-
112
-
113
-
114
-
115
-
116
-
117
-
118
-
119
-
120
-
121
-
122
-
123
-
124
-
125
-
126
-
127
-
128
-
129
-
130
-
131
-
132
-
133
-
134
-
135
-
136
-
137
-
138
-
139
-
140
-
141
-
142
-
143
-
144
-
145
-
146
-
147
-
148
-
149
-
150
-
151
-
152
-
153
-
154
-
155
-
156
-
157
-
158
-
159
-
160
-
161
-
162
-
163
-
164
-
165
-
166
-
167
-
168
-
169
-
170
-
171
-
172
-
173
-
174
-
175
-
176
-
177
-
178
-
179
-
180
-
181
-
182
-
183
-
184
-
185
-
186
-
187
-
188
-
189
-
190
-
191
-
192
-
193
-
194
-
195
-
196
-
197
-
198
-
199
-
200
-
201
-
202
-
203
-
204
-
205
-
206
-
207
-
208
-
209
-
210
-
211
-
212
-
213
-
214
-
215
-
216
-
217
-
218
-
219
-
220
-
221
-
222
-
223
-
224
-
225
-
226
-
227
-
228
-
229
-
230
-
231
-
232
-
233
-
234
-
235
-
236
-
237
-
238
-
239
-
240
-
241
-
242
-
243
-
244
-
245
-
246
-
247
-
248
-
249
-
250
-
251
-
252
-
253
-
254
-
255
 |
 |
99
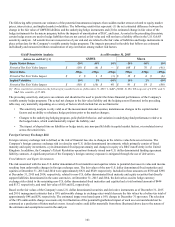
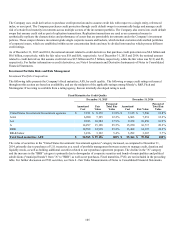
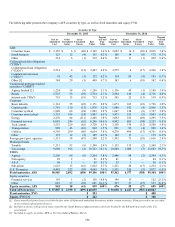
The following tables summarize the account values of the Company’s variable annuities with guarantee features and the NAR split
between various guarantee features (retained net amount at risk does not take into consideration the effects of the variable annuity hedge
programs in place as of each balance sheet date):
Total Variable Annuity Guarantees
As of December 31, 2015
($ in billions) Account
Value
Gross Net
Amount at
Risk
Retained Net
Amount at
Risk
% of
Contracts In
the Money[2] % In the
Money [2] [3]
U.S. Variable Annuity [1]
GMDB $ 44.2 $ 4.2 $ 1.1 55% 9%
GMWB 20.2 0.2 0.2 11% 9%
Total Variable Annuity Guarantees
As of December 31, 2014
($ in billions) Account
Value
Gross Net
Amount at
Risk
Retained Net
Amount at
Risk
% of
Contracts In
the Money [2] % In the
Money [2] [3]
U.S. Variable Annuity [1]
GMDB $ 52.9 $ 3.8 $ 0.8 23% 14%
GMWB 24.8 0.2 0.1 6% 11%
[1] Policies with a guaranteed living benefit also have a guaranteed death benefit. The NAR for each benefit is shown; however these benefits are not
additive. When a policy terminates due to death, any NAR related to GMWB is released. Similarly, when a policy goes into benefit status on a
GMWB, the GMDB NAR is reduced to zero.
[2] Excludes contracts that are fully reinsured.
[3] For all contracts that are “in the money”, this represents the percentage by which the average contract was in the money.
Many policyholders with a GMDB also have a GMWB. Policyholders that have a product that offers both guarantees can only receive
the GMDB or GMWB. The GMDB NAR disclosed in the preceding tables is a point in time measurement and assumes that all
participants utilize the GMDB benefit on that measurement date. For additional information on the Company's GMDB liability, see Note
9 - Separate Accounts, Death Benefits and Other Insurance Benefit Features of Notes to Consolidated Financial Statements.
The Company expects to incur GMDB payments in the future only if the policyholder has an “in the money” GMDB at their death. For
policies with a GMWB rider, the company expects to incur GMWB payments in the future only if the account value is reduced over time
to a specified level through a combination of market performance and periodic withdrawals, at which point the contract holder will
receive an annuity equal to the GRB which is generally equal to premiums less withdrawals. For the Company’s “life-time” GMWB
products, this annuity can exceed the GRB. As the account value fluctuates with equity market returns on a daily basis and the “life-
time” GMWB payments may exceed the GRB, the ultimate amount to be paid by the Company, if any, is uncertain and could be
significantly more or less than the Company’s current carried liability. For additional information on the Company’ s GMWB liability,
see Note 4 - Fair Value Measurements of Notes to Consolidated Financial Statements.