The Hartford 2015 Annual Report Download - page 247
Download and view the complete annual report
Please find page 247 of the 2015 The Hartford annual report below. You can navigate through the pages in the report by either clicking on the pages listed below, or by using the keyword search tool below to find specific information within the annual report.-
 1
1 -
2
-
3
-
4
-
5
-
6
-
7
-
8
-
9
-
10
-
11
-
12
-
13
-
14
-
15
-
16
-
17
-
18
-
19
-
20
-
21
-
22
-
23
-
24
-
25
-
26
-
27
-
28
-
29
-
30
-
31
-
32
-
33
-
34
-
35
-
36
-
37
-
38
-
39
-
40
-
41
-
42
-
43
-
44
-
45
-
46
-
47
-
48
-
49
-
50
-
51
-
52
-
53
-
54
-
55
-
56
-
57
-
58
-
59
-
60
-
61
-
62
-
63
-
64
-
65
-
66
-
67
-
68
-
69
-
70
-
71
-
72
-
73
-
74
-
75
-
76
-
77
-
78
-
79
-
80
-
81
-
82
-
83
-
84
-
85
-
86
-
87
-
88
-
89
-
90
-
91
-
92
-
93
-
94
-
95
-
96
-
97
-
98
-
99
-
100
-
101
-
102
-
103
-
104
-
105
-
106
-
107
-
108
-
109
-
110
-
111
-
112
-
113
-
114
-
115
-
116
-
117
-
118
-
119
-
120
-
121
-
122
-
123
-
124
-
125
-
126
-
127
-
128
-
129
-
130
-
131
-
132
-
133
-
134
-
135
-
136
-
137
-
138
-
139
-
140
-
141
-
142
-
143
-
144
-
145
-
146
-
147
-
148
-
149
-
150
-
151
-
152
-
153
-
154
-
155
-
156
-
157
-
158
-
159
-
160
-
161
-
162
-
163
-
164
-
165
-
166
-
167
-
168
-
169
-
170
-
171
-
172
-
173
-
174
-
175
-
176
-
177
-
178
-
179
-
180
-
181
-
182
-
183
-
184
-
185
-
186
-
187
-
188
-
189
-
190
-
191
-
192
-
193
-
194
-
195
-
196
-
197
-
198
-
199
-
200
-
201
-
202
-
203
-
204
-
205
-
206
-
207
-
208
-
209
-
210
-
211
-
212
-
213
-
214
-
215
-
216
-
217
-
218
-
219
-
220
-
221
-
222
-
223
-
224
-
225
-
226
-
227
-
228
-
229
-
230
-
231
-
232
-
233
-
234
-
235
-
236
-
 237
237 -
 238
238 -
 239
239 -
 240
240 -
 241
241 -
 242
242 -
 243
243 -
 244
244 -
 245
245 -
 246
246 -
 247
247 -
 248
248 -
 249
249 -
 250
250 -
 251
251 -
 252
252 -
 253
253 -
 254
254 -
 255
255
 |
 |

II-7
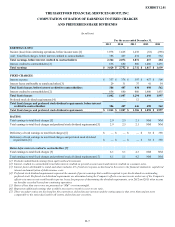
EXHIBIT 12.01
THE HARTFORD FINANCIAL SERVICES GROUP, INC.
COMPUTATION OF RATIOS OF EARNINGS TO FIXED CHARGES
AND PREFERRED SHARE DIVIDENDS
(In millions)
For the years ended December 31,
2015 2014 2013 2012 2011
EARNINGS (LOSS):
Income (loss) from continuing operations, before income taxes [1] 1,978 1,665 1,438 (81) (358)
Add: Total fixed charges, before interest credited to contractholders 386 407 434 498 562
Total earnings, before interest credited to contractholders 2,364 2,072 1,872 417 204
Interest credited to contractholders [2] 656 680 860 1,400 1,435
Total earnings $ 3,020 $ 2,752 $ 2,732 $ 1,817 $ 1,639
FIXED CHARGES:
Interest expense $ 357 $ 376 $ 397 $ 457 $ 508
Interest factor attributable to rentals and other [3] 29 31 37 41 54
Total fixed charges, before interest credited to contractholders 386 407 434 498 562
Interest credited to contractholders [2] 656 680 860 1,400 1,435
Total fixed charges 1,042 1,087 1,294 1,898 1,997
Preferred stock dividend requirements [4] — — 12 — —
Total fixed charges and preferred stock dividend requirements, before interest
credited to contractholders 386 407 446 498 562
Total fixed charges and preferred stock dividend requirements $ 1,042 $ 1,087 $ 1,306 $ 1,898 $ 1,997
RATIOS:
Total earnings to total fixed charges [5] 2.9 2.5 2.1 NM NM
Total earnings to total fixed charges and preferred stock dividend requirements [5] 2.9 2.5 2.1 NM NM
Deficiency of total earnings to total fixed charges [6] $ — $ — $ — $ 81 $ 358
Deficiency of total earnings to total fixed charges and preferred stock dividend
requirements [6] $ — $ — $ — $ 81 $ 358
Ratios before interest credited to contractholders [7]
Total earnings to total fixed charges [5] 6.1 5.1 4.3 NM NM
Total earnings to total fixed charges and preferred stock dividend requirements [5] 6.1 5.1 4.2 NM NM
[1] Excludes undistributed earnings from equity method investments.
[2] Interest credited to contractholders includes interest credited on general account assets and interest credited on consumer notes.
[3] Interest factor attributable to rental and others includes 1/3 of total rent expense as disclosed in the notes to the financial statements, capitalized
interest and amortization of debt issuance costs.
[4] Preferred stock dividend requirements represent the amount of pre-tax earnings that would be required to pay the dividends on outstanding
preferred stock. Preferred stock dividend requirements are determined using the Company's effective income tax rate unless use of the Company's
effective income tax rate would result in pre-tax losses for purposes of determining the dividend requirements, as in 2012 and 2011 when income
tax benefits exceeded losses from continuing operations.
[5] Ratios of less than one-to-one are presented as “NM” or not meaningful.
[6] Represents additional earnings that would be necessary to result in a one-to-one ratio.
[7] These secondary ratios are disclosed for the convenience of fixed income investors and the rating agencies that serve them and are more
comparable to the ratios disclosed by all issuers of fixed income securities.