The Hartford 2015 Annual Report Download - page 156
Download and view the complete annual report
Please find page 156 of the 2015 The Hartford annual report below. You can navigate through the pages in the report by either clicking on the pages listed below, or by using the keyword search tool below to find specific information within the annual report.-
 1
1 -
2
-
3
-
4
-
5
-
6
-
7
-
8
-
9
-
10
-
11
-
12
-
13
-
14
-
15
-
16
-
17
-
18
-
19
-
20
-
21
-
22
-
23
-
24
-
25
-
26
-
27
-
28
-
29
-
30
-
31
-
32
-
33
-
34
-
35
-
36
-
37
-
38
-
39
-
40
-
41
-
42
-
43
-
44
-
45
-
46
-
47
-
48
-
49
-
50
-
51
-
52
-
53
-
54
-
55
-
56
-
57
-
58
-
59
-
60
-
61
-
62
-
63
-
64
-
65
-
66
-
67
-
68
-
69
-
70
-
71
-
72
-
73
-
74
-
75
-
76
-
77
-
78
-
79
-
80
-
81
-
82
-
83
-
84
-
85
-
86
-
87
-
88
-
89
-
90
-
91
-
92
-
93
-
94
-
95
-
96
-
97
-
98
-
99
-
100
-
101
-
102
-
103
-
104
-
105
-
106
-
107
-
108
-
109
-
110
-
111
-
112
-
113
-
114
-
115
-
116
-
117
-
118
-
119
-
120
-
121
-
122
-
123
-
124
-
125
-
126
-
127
-
128
-
129
-
130
-
131
-
132
-
133
-
134
-
135
-
136
-
137
-
138
-
139
-
140
-
141
-
142
-
143
-
144
-
145
-
 146
146 -
 147
147 -
 148
148 -
 149
149 -
 150
150 -
 151
151 -
 152
152 -
 153
153 -
 154
154 -
 155
155 -
 156
156 -
 157
157 -
 158
158 -
 159
159 -
 160
160 -
 161
161 -
 162
162 -
 163
163 -
 164
164 -
 165
165 -
 166
166 -
167
-
168
-
169
-
170
-
171
-
172
-
173
-
174
-
175
-
176
-
177
-
178
-
179
-
180
-
181
-
182
-
183
-
184
-
185
-
186
-
187
-
188
-
189
-
190
-
191
-
192
-
193
-
194
-
195
-
196
-
197
-
198
-
199
-
200
-
201
-
202
-
203
-
204
-
205
-
206
-
207
-
208
-
209
-
210
-
211
-
212
-
213
-
214
-
215
-
216
-
217
-
218
-
219
-
220
-
221
-
222
-
223
-
224
-
225
-
226
-
227
-
228
-
229
-
230
-
231
-
232
-
233
-
234
-
235
-
236
-
237
-
238
-
239
-
240
-
241
-
242
-
243
-
244
-
245
-
246
-
247
-
248
-
249
-
250
-
251
-
252
-
253
-
254
-
255
 |
 |
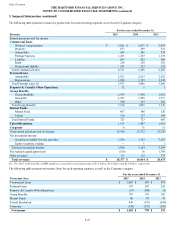
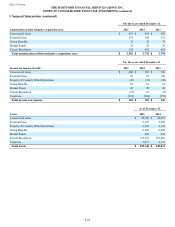
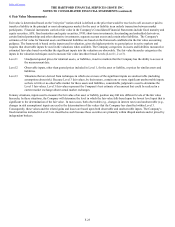
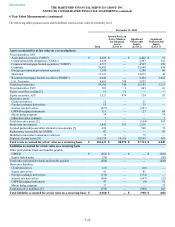
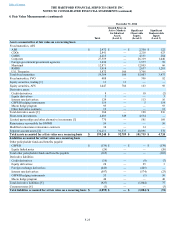
Table of Contents THE HARTFORD FINANCIAL SERVICES GROUP, INC.
NOTES TO CONSOLIDATED FINANCIAL STATEMENTS (continued)
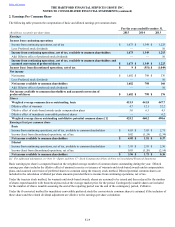
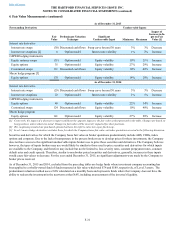
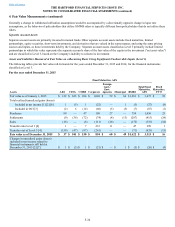
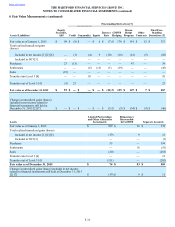
4. Fair Value Measurements (continued)
F-25
December 31, 2014
Total
Quoted Prices in
Active Markets
for Identical
Assets
(Level 1)
Significant
Observable
Inputs
(Level 2)
Significant
Unobservable
Inputs
(Level 3)
Assets accounted for at fair value on a recurring basis
Fixed maturities, AFS
ABS $ 2,472 $ — $ 2,350 $ 122
CDOs 2,841 — 2,218 623
CMBS 4,415 — 4,131 284
Corporate 27,359 — 26,319 1,040
Foreign government/government agencies 1,636 — 1,577 59
Municipal 12,871 — 12,805 66
RMBS 3,918 — 2,637 1,281
U.S. Treasuries 3,872 106 3,766 —
Total fixed maturities 59,384 106 55,803 3,475
Fixed maturities, FVO 488 — 396 92
Equity securities, trading [1] 11 11 — —
Equity securities, AFS 1,047 786 163 98
Derivative assets
Credit derivatives 8 — 10 (2)
Equity derivatives 3 — — 3
Interest rate derivatives 129 — 113 16
GMWB hedging instruments 119 — 5 114
Macro hedge program 93 — — 93
Other derivative contracts 12 — — 12
Total derivative assets [2] 364 — 128 236
Short-term investments 4,883 349 4,534 —
Limited partnerships and other alternative investments [3] 770 — 581 189
Reinsurance recoverable for GMWB 56 — — 56
Modified coinsurance reinsurance contracts 34 — 34 —
Separate account assets [4] 132,211 91,537 40,096 578
Total assets accounted for at fair value on a recurring basis $ 199,248 $ 92,789 $ 101,735 $ 4,724
Liabilities accounted for at fair value on a recurring basis
Other policyholder funds and benefits payable
GMWB $ (139) $ — $ — $ (139)
Equity linked notes (26) — — (26)
Total other policyholder funds and benefits payable (165) — — (165)
Derivative liabilities
Credit derivatives (16) — (9) (7)
Equity derivatives 28 — 25 3
Foreign exchange derivatives (445) — (445) —
Interest rate derivatives (597) — (574) (23)
GMWB hedging instruments 55 — (1) 56
Macro hedge program 48 — — 48
Total derivative liabilities [5] (927) — (1,004) 77
Consumer notes [6] (3) — — (3)
Total liabilities accounted for at fair value on a recurring basis $ (1,095) $ — $ (1,004) $ (91)