The Hartford 2015 Annual Report Download - page 59
Download and view the complete annual report
Please find page 59 of the 2015 The Hartford annual report below. You can navigate through the pages in the report by either clicking on the pages listed below, or by using the keyword search tool below to find specific information within the annual report.-
 1
1 -
 2
2 -
 3
3 -
 4
4 -
 5
5 -
 6
6 -
 7
7 -
 8
8 -
 9
9 -
 10
10 -
 11
11 -
 12
12 -
 13
13 -
 14
14 -
 15
15 -
 16
16 -
 17
17 -
 18
18 -
 19
19 -
 20
20 -
 21
21 -
 22
22 -
 23
23 -
 24
24 -
 25
25 -
 26
26 -
 27
27 -
 28
28 -
 29
29 -
 30
30 -
 31
31 -
 32
32 -
 33
33 -
 34
34 -
 35
35 -
 36
36 -
 37
37 -
 38
38 -
 39
39 -
 40
40 -
 41
41 -
 42
42 -
 43
43 -
 44
44 -
 45
45 -
 46
46 -
 47
47 -
 48
48 -
 49
49 -
 50
50 -
 51
51 -
 52
52 -
 53
53 -
 54
54 -
 55
55 -
 56
56 -
 57
57 -
 58
58 -
 59
59 -
 60
60 -
 61
61 -
 62
62 -
 63
63 -
 64
64 -
 65
65 -
 66
66 -
 67
67 -
 68
68 -
 69
69 -
 70
70 -
 71
71 -
 72
72 -
 73
73 -
 74
74 -
 75
75 -
 76
76 -
 77
77 -
 78
78 -
 79
79 -
 80
80 -
 81
81 -
 82
82 -
 83
83 -
 84
84 -
 85
85 -
 86
86 -
 87
87 -
 88
88 -
 89
89 -
 90
90 -
 91
91 -
 92
92 -
 93
93 -
 94
94 -
 95
95 -
 96
96 -
 97
97 -
 98
98 -
 99
99 -
 100
100 -
 101
101 -
 102
102 -
 103
103 -
 104
104 -
 105
105 -
 106
106 -
 107
107 -
 108
108 -
 109
109 -
 110
110 -
 111
111 -
 112
112 -
 113
113 -
 114
114 -
 115
115 -
 116
116 -
 117
117 -
 118
118 -
 119
119 -
 120
120 -
 121
121 -
 122
122 -
 123
123 -
 124
124 -
 125
125 -
 126
126 -
 127
127 -
 128
128 -
 129
129 -
 130
130 -
 131
131 -
 132
132 -
 133
133 -
 134
134 -
 135
135 -
 136
136 -
 137
137 -
 138
138 -
 139
139 -
 140
140 -
 141
141 -
 142
142 -
 143
143 -
 144
144 -
 145
145 -
 146
146 -
 147
147 -
 148
148 -
 149
149 -
 150
150 -
 151
151 -
 152
152 -
 153
153 -
 154
154 -
 155
155 -
 156
156 -
 157
157 -
 158
158 -
 159
159 -
 160
160 -
 161
161 -
 162
162 -
 163
163 -
 164
164 -
 165
165 -
 166
166 -
 167
167 -
 168
168 -
 169
169 -
 170
170 -
 171
171 -
 172
172 -
 173
173 -
 174
174 -
 175
175 -
 176
176 -
 177
177 -
 178
178 -
 179
179 -
 180
180 -
 181
181 -
 182
182 -
 183
183 -
 184
184 -
 185
185 -
 186
186 -
 187
187 -
 188
188 -
 189
189 -
 190
190 -
 191
191 -
 192
192 -
 193
193 -
 194
194 -
 195
195 -
 196
196 -
 197
197 -
 198
198 -
 199
199 -
 200
200 -
 201
201 -
 202
202 -
 203
203 -
 204
204 -
 205
205 -
 206
206 -
 207
207 -
 208
208 -
 209
209 -
 210
210 -
 211
211 -
 212
212 -
 213
213 -
 214
214 -
 215
215 -
 216
216 -
 217
217 -
 218
218 -
 219
219 -
 220
220 -
 221
221 -
 222
222 -
 223
223 -
 224
224 -
 225
225 -
 226
226 -
 227
227 -
 228
228 -
 229
229 -
 230
230 -
 231
231 -
 232
232 -
 233
233 -
 234
234 -
 235
235 -
 236
236 -
 237
237 -
 238
238 -
 239
239 -
 240
240 -
 241
241 -
 242
242 -
 243
243 -
 244
244 -
 245
245 -
 246
246 -
 247
247 -
 248
248 -
 249
249 -
 250
250 -
 251
251 -
 252
252 -
 253
253 -
 254
254 -
 255
255
 |
 |

59
The Company provides an allowance for uncollectible reinsurance, reflecting management’s best estimate of reinsurance cessions that
may be uncollectible in the future due to reinsurers’ unwillingness or inability to pay. The Company currently expects to perform its
regular comprehensive review of Property & Casualty Other Operations reinsurance recoverables annually. During the second quarters
of 2015, 2014 and 2013, the Company completed its annual evaluations of the collectability of the reinsurance recoverables and the
adequacy of the allowance for uncollectible reinsurance associated with older, long-term casualty liabilities reported in the Property &
Casualty Other Operations. In conducting this evaluation, the Company used its most recent detailed evaluations of ceded liabilities
reported in the segment. The Company analyzed the overall credit quality of the Company’s reinsurers, recent trends in arbitration and
litigation outcomes in disputes between cedants and reinsurers and recent developments in commutation activity between reinsurers and
cedants. The evaluation in the second quarters of 2015, 2014, and 2013 resulted in no material adjustments to the allowance for
uncollectible reinsurance. As of December 31, 2015, 2014, and 2013, the allowance for uncollectible reinsurance for Property &
Casualty Other Operations totaled $220, $225, and $202. Due to the inherent uncertainties as to collection and the length of time before
reinsurance recoverables become due, particularly for older, long-term casualty liabilities, it is possible that future adjustments to the
Company’s reinsurance recoverables, net of the allowance, could be required.
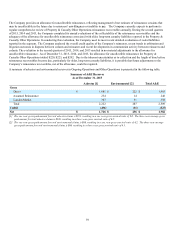
A summary of asbestos and environmental reserves in Ongoing Operations and Other Operations is presented in the following table.
Summary of A&E Reserves
As of December 31, 2015
Asbestos [1] Environmental [2] Total A&E
Gross
Direct $ 1,681 $ 222 $ 1,903
Assumed Reinsurance 234 14 248
London Market 307 51 358
Total 2,222 287 2,509
Ceded (496)(31) (527)
Net $ 1,726 $ 256 $ 1,982
[1] The one year gross paid amount for total asbestos claims is $231, resulting in a one year gross survival ratio of 9.6. The three year average gross
paid amount for total asbestos claims is $263, resulting in a three year gross survival ratio of 8.5.
[2] The one year gross paid amount for total environmental claims is $68, resulting in a one year gross survival ratio of 4.2. The three year average
gross paid amount for total environmental claims is $64, resulting in a three year gross survival ratio of 4.5.
