The Hartford 2015 Annual Report Download - page 217
Download and view the complete annual report
Please find page 217 of the 2015 The Hartford annual report below. You can navigate through the pages in the report by either clicking on the pages listed below, or by using the keyword search tool below to find specific information within the annual report.-
 1
1 -
2
-
3
-
4
-
5
-
6
-
7
-
8
-
9
-
10
-
11
-
12
-
13
-
14
-
15
-
16
-
17
-
18
-
19
-
20
-
21
-
22
-
23
-
24
-
25
-
26
-
27
-
28
-
29
-
30
-
31
-
32
-
33
-
34
-
35
-
36
-
37
-
38
-
39
-
40
-
41
-
42
-
43
-
44
-
45
-
46
-
47
-
48
-
49
-
50
-
51
-
52
-
53
-
54
-
55
-
56
-
57
-
58
-
59
-
60
-
61
-
62
-
63
-
64
-
65
-
66
-
67
-
68
-
69
-
70
-
71
-
72
-
73
-
74
-
75
-
76
-
77
-
78
-
79
-
80
-
81
-
82
-
83
-
84
-
85
-
86
-
87
-
88
-
89
-
90
-
91
-
92
-
93
-
94
-
95
-
96
-
97
-
98
-
99
-
100
-
101
-
102
-
103
-
104
-
105
-
106
-
107
-
108
-
109
-
110
-
111
-
112
-
113
-
114
-
115
-
116
-
117
-
118
-
119
-
120
-
121
-
122
-
123
-
124
-
125
-
126
-
127
-
128
-
129
-
130
-
131
-
132
-
133
-
134
-
135
-
136
-
137
-
138
-
139
-
140
-
141
-
142
-
143
-
144
-
145
-
146
-
147
-
148
-
149
-
150
-
151
-
152
-
153
-
154
-
155
-
156
-
157
-
158
-
159
-
160
-
161
-
162
-
163
-
164
-
165
-
166
-
167
-
168
-
169
-
170
-
171
-
172
-
173
-
174
-
175
-
176
-
177
-
178
-
179
-
180
-
181
-
182
-
183
-
184
-
185
-
186
-
187
-
188
-
189
-
190
-
191
-
192
-
193
-
194
-
195
-
196
-
197
-
198
-
199
-
200
-
201
-
202
-
203
-
204
-
205
-
206
-
 207
207 -
 208
208 -
 209
209 -
 210
210 -
 211
211 -
 212
212 -
 213
213 -
 214
214 -
 215
215 -
 216
216 -
 217
217 -
 218
218 -
 219
219 -
 220
220 -
 221
221 -
 222
222 -
 223
223 -
 224
224 -
 225
225 -
 226
226 -
 227
227 -
228
-
229
-
230
-
231
-
232
-
233
-
234
-
235
-
236
-
237
-
238
-
239
-
240
-
241
-
242
-
243
-
244
-
245
-
246
-
247
-
248
-
249
-
250
-
251
-
252
-
253
-
254
-
255
 |
 |

Table of Contents THE HARTFORD FINANCIAL SERVICES GROUP, INC.
NOTES TO CONSOLIDATED FINANCIAL STATEMENTS (continued)
16. Employee Benefit Plans (continued)
F-86
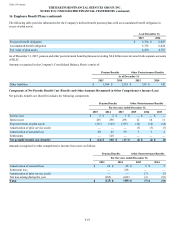
Pension Benefits Other Postretirement
Benefits
For the years ended December 31,
Change in Benefit Obligation 2015 2014 2015 2014
Benefit obligation — beginning of year $ 6,025 $ 5,516 $ 338 $ 312
Service cost 2 2 — —
Interest cost 235 258 12 14
Plan participants’ contributions — — 25 26
Actuarial loss (gain) 18 (8) — 38
Settlements — (319) — —
Changes in assumptions (236) 846 (8) 16
Benefits paid (307)(268)(68) (70)
Retiree drug subsidy — — 2 2
Foreign exchange adjustment (3)(2) — —
Benefit obligation — end of year $ 5,734 $ 6,025 $ 301 $ 338
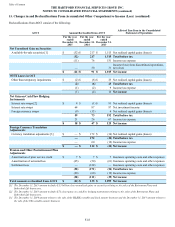
Settlements in 2014 were primarily the result of the Company's extension of a limited time voluntary lump sum offer to approximately
13,500 vested participants in the U.S. qualified defined benefit pension plan who had separated from service, but who had not yet
commenced annuity benefits. The Company made lump sum benefit payments totaling $274 to approximately 5,600 vested participants.
The Company also made lump sum payments of $45 to eligible cash balance participants independent of the voluntary lump sum offer.
Changes in assumptions in 2015 primarily included the effect of an increase in the discount rate. Changes in assumptions in 2014
included an increase of $279 related to the Company's use of updated mortality rates reflecting improved life expectancy and an
increase of $567 related to a reduction in the discount rate.
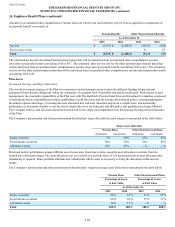
Pension Benefits Other Postretirement
Benefits
For the years ended December 31,
Change in Plan Assets 2015 2014 2015 2014
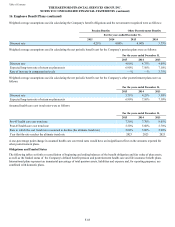
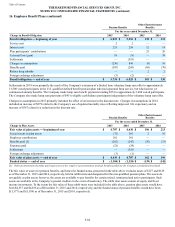
Fair value of plan assets — beginning of year $ 4,707 $ 4,630 $ 196 $ 213
Actual return on plan assets (72) 565 2 16
Employer contributions 101 101 — —
Benefits paid [1] (282)(245)(36) (33)
Expenses paid (21)(24) — —
Settlements — (319) — —
Foreign exchange adjustment (3)(1) — —
Fair value of plan assets — end of year $ 4,430 $ 4,707 $ 162 $ 196
Funded status — end of year $ (1,304) $ (1,318) $ (139) $ (142)
[1] Other postretirement benefits paid represent non-key employee postretirement medical benefits paid from the Company's prefunded trust fund.
The fair value of assets for pension benefits, and hence the funded status, presented in the table above excludes assets of $127 and $129
as of December 31, 2015 and 2014, respectively, held in rabbi trusts and designated for the non-qualified pension plans. The assets do
not qualify as plan assets; however, the assets are available to pay benefits for certain retired, terminated and active participants. Such
assets are available to the Company’s general creditors in the event of insolvency. The rabbi trust assets consist of equity and fixed
income investments. To the extent the fair value of these rabbi trusts were included in the table above, pension plan assets would have
been $4,557 and $4,836 as of December 31, 2015 and 2014, respectively, and the funded status of pension benefits would have been
$(1,177) and $(1,189) as of December 31, 2015 and 2014, respectively.