The Hartford 2015 Annual Report Download - page 83
Download and view the complete annual report
Please find page 83 of the 2015 The Hartford annual report below. You can navigate through the pages in the report by either clicking on the pages listed below, or by using the keyword search tool below to find specific information within the annual report.-
 1
1 -
2
-
3
-
4
-
5
-
6
-
7
-
8
-
9
-
10
-
11
-
12
-
13
-
14
-
15
-
16
-
17
-
18
-
19
-
20
-
21
-
22
-
23
-
24
-
25
-
26
-
27
-
28
-
29
-
30
-
31
-
32
-
33
-
34
-
35
-
36
-
37
-
38
-
39
-
40
-
41
-
42
-
43
-
44
-
45
-
46
-
47
-
48
-
49
-
50
-
51
-
52
-
53
-
54
-
55
-
56
-
57
-
58
-
59
-
60
-
61
-
62
-
63
-
64
-
65
-
66
-
67
-
68
-
69
-
70
-
71
-
72
-
 73
73 -
 74
74 -
 75
75 -
 76
76 -
 77
77 -
 78
78 -
 79
79 -
 80
80 -
 81
81 -
 82
82 -
 83
83 -
 84
84 -
 85
85 -
 86
86 -
 87
87 -
 88
88 -
 89
89 -
 90
90 -
 91
91 -
 92
92 -
 93
93 -
94
-
95
-
96
-
97
-
98
-
99
-
100
-
101
-
102
-
103
-
104
-
105
-
106
-
107
-
108
-
109
-
110
-
111
-
112
-
113
-
114
-
115
-
116
-
117
-
118
-
119
-
120
-
121
-
122
-
123
-
124
-
125
-
126
-
127
-
128
-
129
-
130
-
131
-
132
-
133
-
134
-
135
-
136
-
137
-
138
-
139
-
140
-
141
-
142
-
143
-
144
-
145
-
146
-
147
-
148
-
149
-
150
-
151
-
152
-
153
-
154
-
155
-
156
-
157
-
158
-
159
-
160
-
161
-
162
-
163
-
164
-
165
-
166
-
167
-
168
-
169
-
170
-
171
-
172
-
173
-
174
-
175
-
176
-
177
-
178
-
179
-
180
-
181
-
182
-
183
-
184
-
185
-
186
-
187
-
188
-
189
-
190
-
191
-
192
-
193
-
194
-
195
-
196
-
197
-
198
-
199
-
200
-
201
-
202
-
203
-
204
-
205
-
206
-
207
-
208
-
209
-
210
-
211
-
212
-
213
-
214
-
215
-
216
-
217
-
218
-
219
-
220
-
221
-
222
-
223
-
224
-
225
-
226
-
227
-
228
-
229
-
230
-
231
-
232
-
233
-
234
-
235
-
236
-
237
-
238
-
239
-
240
-
241
-
242
-
243
-
244
-
245
-
246
-
247
-
248
-
249
-
250
-
251
-
252
-
253
-
254
-
255
 |
 |

83
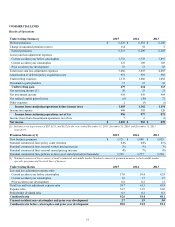
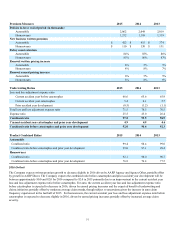
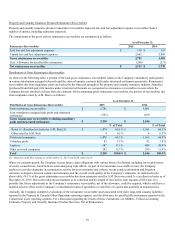
MUTUAL FUNDS
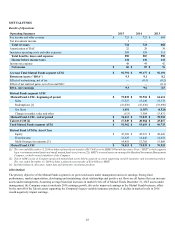
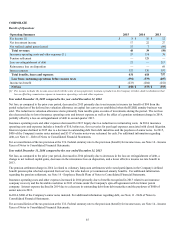
Results of Operations
Operating Summary 2015 2014 2013
Fee income and other revenue $ 723 $ 723 $ 668
Net investment income 1 — —
Total revenues 724 723 668
Amortization of DAC 22 28 39
Insurance operating costs and other expenses 568 559 511
Total benefits, losses and expenses 590 587 550
Income before income taxes 134 136 118
Income tax expense 48 49 42
Net income $ 86 $ 87 $ 76
Average Total Mutual Funds segment AUM $ 92,791 $ 95,177 $ 92,191
Return on Assets ("ROA") 9.3 9.1 8.2
Effect of restructuring, net of tax — (0.5) (0.2)
Effect of net realized gains, net of tax and DAC — — (0.1)
ROA, core earnings 9.3 9.6 8.5
Mutual Funds segment AUM
Mutual Fund AUM - beginning of period $ 73,035 $ 70,918 $ 61,611
Sales 17,527 15,249 15,172
Redemptions [1] (16,036)(16,636) (19,696)
Net flows 1,491 (1,387) (4,524)
Change in market value and other (113) 3,504 13,831
Mutual Fund AUM - end of period $ 74,413 $ 73,035 $ 70,918
Talcott AUM [2] $ 17,549 $ 20,584 $ 25,817
Total Mutual Funds segment AUM $ 91,962 $ 93,619 $ 96,735
Mutual Fund AUM by Asset Class
Equity $ 47,369 $ 45,221 $ 42,426
Fixed Income 12,625 14,046 14,632
Multi-Strategy Investments [3] 14,419 13,768 13,860
Mutual Fund AUM $ 74,413 $ 73,035 $ 70,918
[1] The year ended December 31, 2014 includes a planned asset transfer of $0.7 billion to the HIMCO Variable Insurance Trust (“HVIT”) which supports
legacy retirement mutual funds and runoff mutual funds (see footnote [2]). HVIT's invested assets are managed by Hartford Investment Management
Company, a wholly-owned subsidiary of the Company.
[2] Talcott AUM consist of Company-sponsored mutual fund assets held in separate accounts supporting variable insurance and investment products.
The year ended December 31, 2014 includes a planned asset transfer of $2.0 billion to HVIT.
[3] Includes balanced, allocation, target date and alternative investment products.
2016 Outlook
The primary objective of the Mutual Funds segment is to grow total assets under management and core earnings. Strong fund
performance, market appreciation, developing and maintaining client relationships and positive net flows are all factors that can increase
assets under management. Assuming average historical increases in market levels off of Mutual Funds December 31, 2015 assets under
management, the Company expects moderate 2016 earnings growth, driven by improved earnings in the Mutual Funds business, offset
by the run-off of the Talcott assets supporting the Company's legacy variable insurance products. A decline in market levels in 2016
would negatively impact earnings.