The Hartford 2015 Annual Report Download - page 38
Download and view the complete annual report
Please find page 38 of the 2015 The Hartford annual report below. You can navigate through the pages in the report by either clicking on the pages listed below, or by using the keyword search tool below to find specific information within the annual report.-
 1
1 -
2
-
3
-
4
-
5
-
6
-
7
-
8
-
9
-
10
-
11
-
12
-
13
-
14
-
15
-
16
-
17
-
18
-
19
-
20
-
21
-
22
-
23
-
24
-
25
-
26
-
27
-
 28
28 -
 29
29 -
 30
30 -
 31
31 -
 32
32 -
 33
33 -
 34
34 -
 35
35 -
 36
36 -
 37
37 -
 38
38 -
 39
39 -
 40
40 -
 41
41 -
 42
42 -
 43
43 -
 44
44 -
 45
45 -
 46
46 -
 47
47 -
 48
48 -
49
-
50
-
51
-
52
-
53
-
54
-
55
-
56
-
57
-
58
-
59
-
60
-
61
-
62
-
63
-
64
-
65
-
66
-
67
-
68
-
69
-
70
-
71
-
72
-
73
-
74
-
75
-
76
-
77
-
78
-
79
-
80
-
81
-
82
-
83
-
84
-
85
-
86
-
87
-
88
-
89
-
90
-
91
-
92
-
93
-
94
-
95
-
96
-
97
-
98
-
99
-
100
-
101
-
102
-
103
-
104
-
105
-
106
-
107
-
108
-
109
-
110
-
111
-
112
-
113
-
114
-
115
-
116
-
117
-
118
-
119
-
120
-
121
-
122
-
123
-
124
-
125
-
126
-
127
-
128
-
129
-
130
-
131
-
132
-
133
-
134
-
135
-
136
-
137
-
138
-
139
-
140
-
141
-
142
-
143
-
144
-
145
-
146
-
147
-
148
-
149
-
150
-
151
-
152
-
153
-
154
-
155
-
156
-
157
-
158
-
159
-
160
-
161
-
162
-
163
-
164
-
165
-
166
-
167
-
168
-
169
-
170
-
171
-
172
-
173
-
174
-
175
-
176
-
177
-
178
-
179
-
180
-
181
-
182
-
183
-
184
-
185
-
186
-
187
-
188
-
189
-
190
-
191
-
192
-
193
-
194
-
195
-
196
-
197
-
198
-
199
-
200
-
201
-
202
-
203
-
204
-
205
-
206
-
207
-
208
-
209
-
210
-
211
-
212
-
213
-
214
-
215
-
216
-
217
-
218
-
219
-
220
-
221
-
222
-
223
-
224
-
225
-
226
-
227
-
228
-
229
-
230
-
231
-
232
-
233
-
234
-
235
-
236
-
237
-
238
-
239
-
240
-
241
-
242
-
243
-
244
-
245
-
246
-
247
-
248
-
249
-
250
-
251
-
252
-
253
-
254
-
255
 |
 |
38
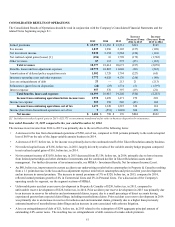
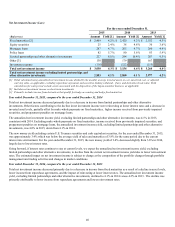
• A $227, before tax, decrease in DAC amortization driven, in part, by a favorable unlock in Talcott Resolution in 2015, compared to
unfavorable in 2014.
• Pension settlement charge of $128, before tax, in 2014, within insurance operating costs and other expenses, related to voluntary
lump-sum settlements with vested participants in the Company's defined benefit pension plan who had separated from service, but
who had not yet commenced annuity benefits.
• Differences between the Company's effective income tax rate and the U.S. statutory rate of 35% are due primarily to tax-exempt
interest earned on invested assets and the dividends received deduction ("DRD"). Income tax expense in 2015, decreased by $45
from $350 in 2014, primarily due to a federal income tax benefit of $36, related to the release of reserves due to the resolution of
uncertain tax positions and a benefit of $94 from the partial reduction of the deferred tax valuation allowance on the capital loss
carryover due to taxable gains on the termination of certain derivatives, partially offset by the effect of higher income from
continuing operations, before tax. For further discussion of income taxes, see Note 14 - Income Taxes of Notes to Consolidated
Financial Statements.
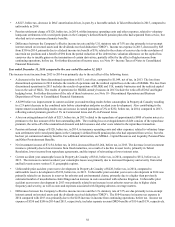
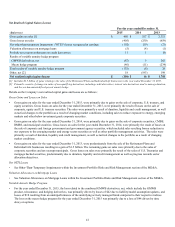
Year ended December 31, 2014 compared to the year ended December 31, 2013
The increase in net income from 2013 to 2014 was primarily due to the net effect of the following items:
• A decrease in the loss from discontinued operations to $551, net of tax, compared to $1,049, net of tax, in 2013. The loss from
discontinued operations in 2014 includes the results of operations and the realized capital loss on the sale of HLIKK. The loss from
discontinued operations in 2013 includes the results of operations of HLIKK and U.K. annuity businesses and the realized capital
loss on the sale of HLIL. The results of operations for HLIKK annuity business in 2013 include the write-off of DAC and higher
hedging losses. For further discussion of the sale of these businesses, see Note 18 - Discontinued Operations and Business
Dispositions of Notes to Consolidated Financial Statements.
• A $299 before tax improvement in current accident year underwriting results before catastrophes in Property & Casualty resulting
in a 2.9 point decrease in the combined ratio before catastrophes and prior accident year development. Also contributing to the
improvement in underwriting results was an increase in earned premiums of 2% or $232, before tax, in 2014, compared to 2013,
reflecting earned premium growth of 1% in Commercial Lines and 4% in Personal Lines.
• A loss on extinguishment of debt of $213, before tax, in 2013 related to the repurchase of approximately $800 of senior notes at a
premium to the face amount of the then outstanding debt. The resulting loss on extinguishment of debt consists of the repurchase
premium, the write-off of the unamortized discount and debt issuance and other costs related to the repurchase transaction.
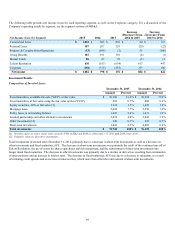
• Pension settlement charge of $128, before tax, in 2014, in insurance operating costs and other expenses, related to voluntary lump-
sum settlements with vested participants in the Company's defined benefit pension plan who had separated from service, but who
had not yet commenced annuity benefits. For additional information, see MD&A - Capital Resources and Liquidity, Pension Plans
and Other Postretirement Benefits.
• Net investment income of $3,154, before tax, in 2014, decreased from $3,264, before tax, in 2013. The decrease in net investment
income is primarily due to lower income from fixed maturities, as a result of a decline in asset levels, primarily in Talcott
Resolution, lower income from repurchase agreements, and the impact of reinvesting at lower interest rates.
• Current accident year catastrophe losses in Property & Casualty of $341, before tax, in 2014, compared to $312, before tax, in
2013. The increase in current accident year catastrophe losses was primarily due to increased frequency and severity from wind
and hail events across various U.S. geographic regions.
• Unfavorable prior accident year reserve development in Property & Casualty of $228, before tax, in 2014, compared to
unfavorable reserve development of $192, before tax, in 2013. Unfavorable prior accident year reserve development in 2014 was
primarily related to an increase in reserves for asbestos and environmental claims, primarily due to a higher than previously
estimated number of mesothelioma claim filings and an increase in costs associated with asbestos litigation. Unfavorable prior
accident year reserve development in 2013 was primarily related to an increase in net asbestos reserves due to higher claim
frequency and severity, as well as costs and expenses associated with litigating asbestos coverage matters.
• Differences between the Company's effective income tax rate and the U.S. statutory rate of 35% are due primarily to tax-exempt
interest earned on invested assets and the dividends received deduction ("DRD"). The $104 increase in income tax expense in
2014 compared with 2013 was primarily due to the $228 increase in income from continuing operations, before tax. Income tax
expense of $350 and $246 in 2014 and 2013, respectively, includes separate account DRD benefits of $114 and $139, respectively.