The Hartford 2015 Annual Report Download - page 105
Download and view the complete annual report
Please find page 105 of the 2015 The Hartford annual report below. You can navigate through the pages in the report by either clicking on the pages listed below, or by using the keyword search tool below to find specific information within the annual report.-
 1
1 -
2
-
3
-
4
-
5
-
6
-
7
-
8
-
9
-
10
-
11
-
12
-
13
-
14
-
15
-
16
-
17
-
18
-
19
-
20
-
21
-
22
-
23
-
24
-
25
-
26
-
27
-
28
-
29
-
30
-
31
-
32
-
33
-
34
-
35
-
36
-
37
-
38
-
39
-
40
-
41
-
42
-
43
-
44
-
45
-
46
-
47
-
48
-
49
-
50
-
51
-
52
-
53
-
54
-
55
-
56
-
57
-
58
-
59
-
60
-
61
-
62
-
63
-
64
-
65
-
66
-
67
-
68
-
69
-
70
-
71
-
72
-
73
-
74
-
75
-
76
-
77
-
78
-
79
-
80
-
81
-
82
-
83
-
84
-
85
-
86
-
87
-
88
-
89
-
90
-
91
-
92
-
93
-
94
-
 95
95 -
 96
96 -
 97
97 -
 98
98 -
 99
99 -
 100
100 -
 101
101 -
 102
102 -
 103
103 -
 104
104 -
 105
105 -
 106
106 -
 107
107 -
 108
108 -
 109
109 -
 110
110 -
 111
111 -
 112
112 -
 113
113 -
 114
114 -
 115
115 -
116
-
117
-
118
-
119
-
120
-
121
-
122
-
123
-
124
-
125
-
126
-
127
-
128
-
129
-
130
-
131
-
132
-
133
-
134
-
135
-
136
-
137
-
138
-
139
-
140
-
141
-
142
-
143
-
144
-
145
-
146
-
147
-
148
-
149
-
150
-
151
-
152
-
153
-
154
-
155
-
156
-
157
-
158
-
159
-
160
-
161
-
162
-
163
-
164
-
165
-
166
-
167
-
168
-
169
-
170
-
171
-
172
-
173
-
174
-
175
-
176
-
177
-
178
-
179
-
180
-
181
-
182
-
183
-
184
-
185
-
186
-
187
-
188
-
189
-
190
-
191
-
192
-
193
-
194
-
195
-
196
-
197
-
198
-
199
-
200
-
201
-
202
-
203
-
204
-
205
-
206
-
207
-
208
-
209
-
210
-
211
-
212
-
213
-
214
-
215
-
216
-
217
-
218
-
219
-
220
-
221
-
222
-
223
-
224
-
225
-
226
-
227
-
228
-
229
-
230
-
231
-
232
-
233
-
234
-
235
-
236
-
237
-
238
-
239
-
240
-
241
-
242
-
243
-
244
-
245
-
246
-
247
-
248
-
249
-
250
-
251
-
252
-
253
-
254
-
255
 |
 |
105
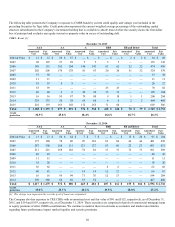
The Company uses credit derivatives to purchase credit protection and to assume credit risk with respect to a single entity, referenced
index, or asset pool. The Company purchases credit protection through credit default swaps to economically hedge and manage credit
risk of certain fixed maturity investments across multiple sectors of the investment portfolio. The Company also enters into credit default
swaps that assume credit risk as part of replication transactions. Replication transactions are used as an economical means to
synthetically replicate the characteristics and performance of assets that are permissible investments under the Company’s investment
policies. These swaps reference investment grade single corporate issuers and baskets, which include customized diversified portfolios
of corporate issuers, which are established within sector concentration limits and may be divided into tranches which possess different
credit ratings.
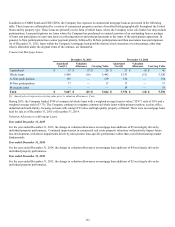
As of December 31, 2015 and 2014, the notional amount related to credit derivatives that purchase credit protection was $0.4 billion and
$0.6 billion, respectively, while the fair value was $18 and $(6), respectively. As of December 31, 2015 and 2014, the notional amount
related to credit derivatives that assume credit risk was $2.5 billion and $1.5 billion, respectively, while the fair value was $(13) and $3,
respectively. For further information on credit derivatives, see Note 6 Investments and Derivative Instruments of Notes to Consolidated
Financial Statements.
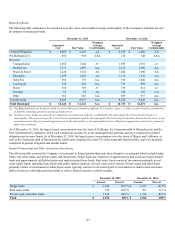
Investment Portfolio Risks and Risk Management
Investment Portfolio Composition
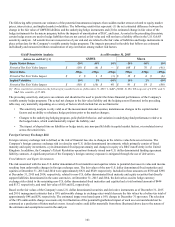
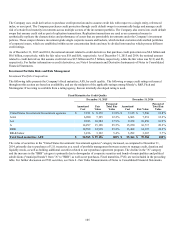
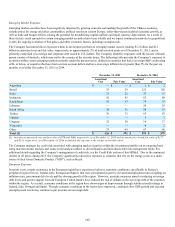
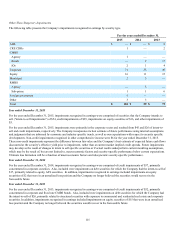
The following table presents the Company’s fixed maturities, AFS, by credit quality. The following average credit ratings referenced
throughout this section are based on availability, and are the midpoint of the applicable ratings among Moody’s, S&P, Fitch and
Morningstar. If no rating is available from a rating agency, then an internally developed rating is used.
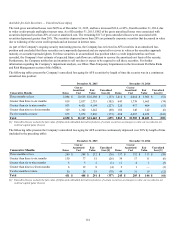
Fixed Maturities by Credit Quality
December 31, 2015 December 31, 2014
Amortized
Cost Fair
Value
Percent of
Total Fair
Value Amortized
Cost Fair Value
Percent of
Total Fair
Value
United States Government/Government agencies $ 7,911 $ 8,179 13.8 % $ 7,135 $ 7,596 12.8 %
AAA 6,980 7,195 12.2 % 6,963 7,251 12.2 %
AA 9,943 10,584 17.9 % 9,258 10,056 16.9 %
A 14,297 15,128 25.5 % 15,250 16,717 28.2 %
BBB 14,598 14,918 25.2 % 13,464 14,397 24.2 %
BB & below 3,236 3,192 5.4 % 3,292 3,367 5.7 %
Total fixed maturities, AFS $ 56,965 $ 59,196 100% $ 55,362 $ 59,384 100%
The value of securities in the "United States Government/ Government agencies" category increased, as compared to December 31,
2014, primarily due to purchases of U.S. treasuries as a result of portfolio management between sectors to manage credit, duration and
liquidity needs, as well as holding additional securities related to our repurchase agreement program. The decline in the "A" category
and the increase in the "BBB" category is primarily due to downgrades of corporate securities and bonds of municipalities and political
subdivisions ("municipal bonds") from "A" to "BBB", as well as net purchases. Fixed maturities, FVO, are not included in the preceding
table. For further discussion on FVO securities, see Note 4 - Fair Value Measurements of Notes to Consolidated Financial Statements.