The Hartford 2015 Annual Report Download - page 35
Download and view the complete annual report
Please find page 35 of the 2015 The Hartford annual report below. You can navigate through the pages in the report by either clicking on the pages listed below, or by using the keyword search tool below to find specific information within the annual report.-
 1
1 -
2
-
3
-
4
-
5
-
6
-
7
-
8
-
9
-
10
-
11
-
12
-
13
-
14
-
15
-
16
-
17
-
18
-
19
-
20
-
21
-
22
-
23
-
24
-
 25
25 -
 26
26 -
 27
27 -
 28
28 -
 29
29 -
 30
30 -
 31
31 -
 32
32 -
 33
33 -
 34
34 -
 35
35 -
 36
36 -
 37
37 -
 38
38 -
 39
39 -
 40
40 -
 41
41 -
 42
42 -
 43
43 -
 44
44 -
 45
45 -
46
-
47
-
48
-
49
-
50
-
51
-
52
-
53
-
54
-
55
-
56
-
57
-
58
-
59
-
60
-
61
-
62
-
63
-
64
-
65
-
66
-
67
-
68
-
69
-
70
-
71
-
72
-
73
-
74
-
75
-
76
-
77
-
78
-
79
-
80
-
81
-
82
-
83
-
84
-
85
-
86
-
87
-
88
-
89
-
90
-
91
-
92
-
93
-
94
-
95
-
96
-
97
-
98
-
99
-
100
-
101
-
102
-
103
-
104
-
105
-
106
-
107
-
108
-
109
-
110
-
111
-
112
-
113
-
114
-
115
-
116
-
117
-
118
-
119
-
120
-
121
-
122
-
123
-
124
-
125
-
126
-
127
-
128
-
129
-
130
-
131
-
132
-
133
-
134
-
135
-
136
-
137
-
138
-
139
-
140
-
141
-
142
-
143
-
144
-
145
-
146
-
147
-
148
-
149
-
150
-
151
-
152
-
153
-
154
-
155
-
156
-
157
-
158
-
159
-
160
-
161
-
162
-
163
-
164
-
165
-
166
-
167
-
168
-
169
-
170
-
171
-
172
-
173
-
174
-
175
-
176
-
177
-
178
-
179
-
180
-
181
-
182
-
183
-
184
-
185
-
186
-
187
-
188
-
189
-
190
-
191
-
192
-
193
-
194
-
195
-
196
-
197
-
198
-
199
-
200
-
201
-
202
-
203
-
204
-
205
-
206
-
207
-
208
-
209
-
210
-
211
-
212
-
213
-
214
-
215
-
216
-
217
-
218
-
219
-
220
-
221
-
222
-
223
-
224
-
225
-
226
-
227
-
228
-
229
-
230
-
231
-
232
-
233
-
234
-
235
-
236
-
237
-
238
-
239
-
240
-
241
-
242
-
243
-
244
-
245
-
246
-
247
-
248
-
249
-
250
-
251
-
252
-
253
-
254
-
255
 |
 |
35
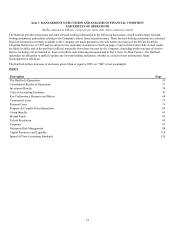
THE HARTFORD’S OPERATIONS
Overview
The Hartford conducts business principally in six reporting segments including Commercial Lines, Personal Lines, Property & Casualty
Other Operations, Group Benefits, Mutual Funds and Talcott Resolution, as well as a Corporate category. The Hartford includes in its
Corporate category the Company’s capital raising activities (including debt financing and related interest expense), purchase accounting
adjustments related to goodwill and other expenses not allocated to the reporting segments.
On June 30, 2014, the Company completed the sale of all of the issued and outstanding equity of Hartford Life Insurance KK, a Japanese
company ("HLIKK") to ORIX Life Insurance Corporation, a subsidiary of ORIX Corporation, a Japanese company. HLIKK sold
variable and fixed annuity policies in Japan from 2001 to 2009 and had been in runoff since 2009.
On December 12, 2013, the Company completed the sale of Hartford Life International Limited ("HLIL"), which comprised the
Company's U.K. variable annuity business, to Columbia Insurance Company, a Berkshire Hathaway company. On January 1, 2013, the
Company completed the sale of its Retirement Plans business to Massachusetts Mutual Life Insurance Company ("MassMutual") and on
January 2, 2013, the Company completed the sale of its Individual Life insurance business to The Prudential Insurance Company of
America ("Prudential"), a subsidiary of Prudential Financial, Inc.
For further discussion of these transactions, see Note 5 - Reinsurance and Note 18 - Discontinued Operations and Business Dispositions
of Notes to Consolidated Financial Statements. The businesses reinsured to MassMutual and Prudential are included in the Talcott
Resolution reporting segment.
The Company derives its revenues principally from: (a) premiums earned for insurance coverage; (b) fee income, including asset
management fees, on separate account and mutual fund assets and mortality and expense fees, as well as cost of insurance charges;
(c) net investment income; (d) fees earned for services provided to third parties; and (e) net realized capital gains and losses. Premiums
charged for insurance coverage are earned principally on a pro rata basis over the terms of the related policies in-force. Asset
management fees and mortality and expense fees are primarily generated from separate account assets. Cost of insurance charges are
assessed on the net amount at risk for investment-oriented life insurance products.
The profitability of the Company's property and casualty insurance businesses over time is greatly influenced by the Company’s
underwriting discipline, which seeks to manage exposure to loss through favorable risk selection and diversification, its management of
claims, its use of reinsurance, the size of its in force block, actual mortality and morbidity experience, and its ability to manage its
expense ratio which it accomplishes through economies of scale and its management of acquisition costs and other underwriting
expenses. Pricing adequacy depends on a number of factors, including the ability to obtain regulatory approval for rate changes, proper
evaluation of underwriting risks, the ability to project future loss cost frequency and severity based on historical loss experience adjusted
for known trends, the Company’s response to rate actions taken by competitors, its expense levels and expectations about regulatory and
legal developments. The Company seeks to price its insurance policies such that insurance premiums and future net investment income
earned on premiums received will cover underwriting expenses and the ultimate cost of paying claims reported on the policies and
provide for a profit margin. For many of its insurance products, the Company is required to obtain approval for its premium rates from
state insurance departments.
The financial results in the Company’s mutual fund and variable annuity businesses depend largely on the amount of the contract holder
or shareholder account value or assets under management on which it earns fees and the level of fees charged. Changes in account value
or assets under management are driven by two main factors: net flows, and the market return of the funds, which is heavily influenced by
the return realized in the equity markets. Net flows are comprised of deposits less withdrawals and surrenders, redemptions, death
benefits, policy charges and annuitizations of investment type contracts, such as variable annuity contracts. In the mutual fund business,
net flows are known as net sales. Net sales are comprised of new sales less redemptions by mutual fund customers. The Company uses
the average daily value of the S&P 500 Index as an indicator for evaluating market returns of the underlying account portfolios.
Financial results of variable products are highly correlated to the growth in account values or assets under management since these
products generally earn fee income on a daily basis. Equity market movements could also result in benefits for or charges against
deferred acquisition costs.
The profitability of fixed annuities and other “spread-based” products depends largely on the Company’s ability to earn target spreads
between earned investment rates on its general account assets and interest credited to policyholders.
The investment return, or yield, on invested assets is an important element of the Company’s earnings since insurance products are
priced with the assumption that premiums received can be invested for a period of time before benefits, loss and loss adjustment
expenses are paid. Due to the need to maintain sufficient liquidity to satisfy claim obligations, the majority of the Company’s invested
assets have been held in available-for-sale securities, including, among other asset classes, equities, corporate bonds, municipal bonds,
government debt, short-term debt, mortgage-backed securities and asset-backed securities and collateralized debt obligations.