The Hartford 2015 Annual Report Download - page 108
Download and view the complete annual report
Please find page 108 of the 2015 The Hartford annual report below. You can navigate through the pages in the report by either clicking on the pages listed below, or by using the keyword search tool below to find specific information within the annual report.-
 1
1 -
2
-
3
-
4
-
5
-
6
-
7
-
8
-
9
-
10
-
11
-
12
-
13
-
14
-
15
-
16
-
17
-
18
-
19
-
20
-
21
-
22
-
23
-
24
-
25
-
26
-
27
-
28
-
29
-
30
-
31
-
32
-
33
-
34
-
35
-
36
-
37
-
38
-
39
-
40
-
41
-
42
-
43
-
44
-
45
-
46
-
47
-
48
-
49
-
50
-
51
-
52
-
53
-
54
-
55
-
56
-
57
-
58
-
59
-
60
-
61
-
62
-
63
-
64
-
65
-
66
-
67
-
68
-
69
-
70
-
71
-
72
-
73
-
74
-
75
-
76
-
77
-
78
-
79
-
80
-
81
-
82
-
83
-
84
-
85
-
86
-
87
-
88
-
89
-
90
-
91
-
92
-
93
-
94
-
95
-
96
-
97
-
 98
98 -
 99
99 -
 100
100 -
 101
101 -
 102
102 -
 103
103 -
 104
104 -
 105
105 -
 106
106 -
 107
107 -
 108
108 -
 109
109 -
 110
110 -
 111
111 -
 112
112 -
 113
113 -
 114
114 -
 115
115 -
 116
116 -
 117
117 -
 118
118 -
119
-
120
-
121
-
122
-
123
-
124
-
125
-
126
-
127
-
128
-
129
-
130
-
131
-
132
-
133
-
134
-
135
-
136
-
137
-
138
-
139
-
140
-
141
-
142
-
143
-
144
-
145
-
146
-
147
-
148
-
149
-
150
-
151
-
152
-
153
-
154
-
155
-
156
-
157
-
158
-
159
-
160
-
161
-
162
-
163
-
164
-
165
-
166
-
167
-
168
-
169
-
170
-
171
-
172
-
173
-
174
-
175
-
176
-
177
-
178
-
179
-
180
-
181
-
182
-
183
-
184
-
185
-
186
-
187
-
188
-
189
-
190
-
191
-
192
-
193
-
194
-
195
-
196
-
197
-
198
-
199
-
200
-
201
-
202
-
203
-
204
-
205
-
206
-
207
-
208
-
209
-
210
-
211
-
212
-
213
-
214
-
215
-
216
-
217
-
218
-
219
-
220
-
221
-
222
-
223
-
224
-
225
-
226
-
227
-
228
-
229
-
230
-
231
-
232
-
233
-
234
-
235
-
236
-
237
-
238
-
239
-
240
-
241
-
242
-
243
-
244
-
245
-
246
-
247
-
248
-
249
-
250
-
251
-
252
-
253
-
254
-
255
 |
 |
108
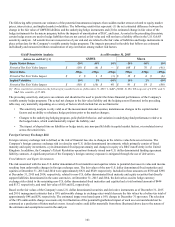
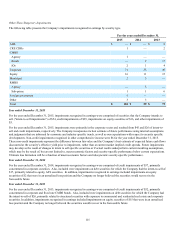
Emerging Market Exposure
Emerging market securities have been negatively impacted by growing concerns surrounding the growth of the Chinese economy,
volatile prices for energy and other commodities, political tension in eastern Europe, softer-than-expected global economic growth, as
well as trade and budget deficits, raising the potential for destabilizing capital outflows and rapid currency depreciation. As a result of
these factors, credit spreads for certain emerging market securities have been volatile and we expect continued sensitivity to geopolitical
events, the ongoing evolution of Fed policy and other economic factors, including contagion risk.
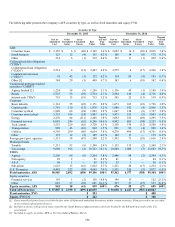
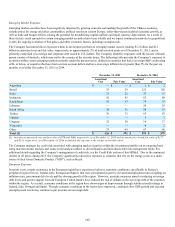
The Company has limited direct exposure within its investment portfolio to emerging market issuers, totaling $1.2 billion and $1.1
billion in amortized cost and fair value, respectively, or approximately 2% of total invested assets as of December 31, 2015, and is
primarily comprised of sovereign and corporate debt issued in U.S. dollars. The Company identifies exposures with the issuers’ ultimate
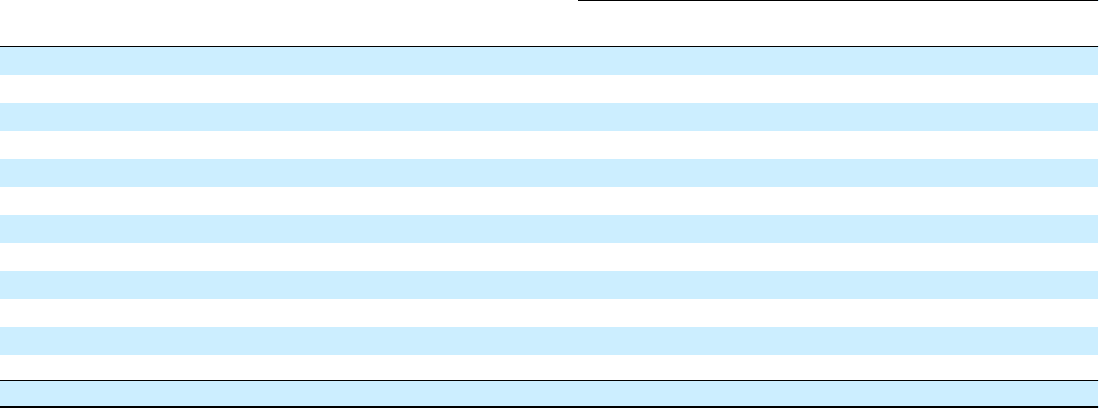
parent country of domicile, which may not be the country of the security issuer. The following table presents the Company’s exposure to
securities within certain emerging markets currently under the greatest stress, defined as countries that had a sovereign S&P credit rating
of B- or below, or countries that have had a current account deficit and have an average inflation level greater than 5% for the past six
months, as of either December 31, 2015 or 2014.
December 31, 2015 December 31, 2014
Amortized
Cost Fair Value Amortized
Cost Fair Value
Argentina $ — $ — $ 2 $ 2
Brazil 33 29 123 120
India 21 21 37 37
Indonesia 92 85 82 80
Kazakhstan 55 53 79 73
Lebanon — — 29 29
South Africa 34 31 54 53
Turkey 76 73 65 67
Ukraine — — 3 3
Uruguay 32 30 16 17
Venezuela — — 4 2
Other 73 69 97 96
Total [1] $ 416 $ 391 $ 591 $ 579
[1] Includes an amortized cost and fair value of $176 and $160, respectively, as of December 31, 2015 and an amortized cost and fair value of $137
and $131, respectively, as of December 31, 2014 included in the exposure to the energy sector table above.
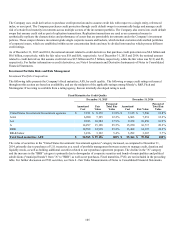
The Company manages the credit risk associated with emerging market securities within the investment portfolio on an on-going basis
using macroeconomic analysis and issuer credit analysis subject to diversification and individual credit risk management limits. For
additional details regarding the Company’s management of credit risk, see the Credit Risk section of this MD&A. Due to the continued
decline in oil prices during 2015, the Company significantly reduced its exposure to countries that rely on the energy sector as a main
source of their Gross Domestic Product ("GDP"), such as Brazil.
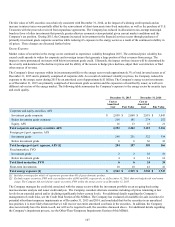
European Exposure
In recent years, certain economies in the European region have experienced adverse economic conditions, specifically in Europe’s
peripheral region (Greece, Ireland, Italy, Portugal and Spain), that were precipitated in part by elevated unemployment rates weighing on
inflation rates, government debt levels and the slowing growth of the region. However, austerity measures aimed at reducing sovereign
debt levels and greater support from the European Central Bank’s have reduced the risk of default on the sovereign debt of the countries
within the region. As a result, economic conditions in the region have shown signs of improvement through stabilized credit ratings in
Ireland, Italy, Portugal and Spain. Though economic conditions in the region have improved, continued slow GDP growth and elevated
unemployment levels may continue to put pressure on sovereign debt.