The Hartford 2015 Annual Report Download - page 41
Download and view the complete annual report
Please find page 41 of the 2015 The Hartford annual report below. You can navigate through the pages in the report by either clicking on the pages listed below, or by using the keyword search tool below to find specific information within the annual report.-
 1
1 -
2
-
3
-
4
-
5
-
6
-
7
-
8
-
9
-
10
-
11
-
12
-
13
-
14
-
15
-
16
-
17
-
18
-
19
-
20
-
21
-
22
-
23
-
24
-
25
-
26
-
27
-
28
-
29
-
30
-
 31
31 -
 32
32 -
 33
33 -
 34
34 -
 35
35 -
 36
36 -
 37
37 -
 38
38 -
 39
39 -
 40
40 -
 41
41 -
 42
42 -
 43
43 -
 44
44 -
 45
45 -
 46
46 -
 47
47 -
 48
48 -
 49
49 -
 50
50 -
 51
51 -
52
-
53
-
54
-
55
-
56
-
57
-
58
-
59
-
60
-
61
-
62
-
63
-
64
-
65
-
66
-
67
-
68
-
69
-
70
-
71
-
72
-
73
-
74
-
75
-
76
-
77
-
78
-
79
-
80
-
81
-
82
-
83
-
84
-
85
-
86
-
87
-
88
-
89
-
90
-
91
-
92
-
93
-
94
-
95
-
96
-
97
-
98
-
99
-
100
-
101
-
102
-
103
-
104
-
105
-
106
-
107
-
108
-
109
-
110
-
111
-
112
-
113
-
114
-
115
-
116
-
117
-
118
-
119
-
120
-
121
-
122
-
123
-
124
-
125
-
126
-
127
-
128
-
129
-
130
-
131
-
132
-
133
-
134
-
135
-
136
-
137
-
138
-
139
-
140
-
141
-
142
-
143
-
144
-
145
-
146
-
147
-
148
-
149
-
150
-
151
-
152
-
153
-
154
-
155
-
156
-
157
-
158
-
159
-
160
-
161
-
162
-
163
-
164
-
165
-
166
-
167
-
168
-
169
-
170
-
171
-
172
-
173
-
174
-
175
-
176
-
177
-
178
-
179
-
180
-
181
-
182
-
183
-
184
-
185
-
186
-
187
-
188
-
189
-
190
-
191
-
192
-
193
-
194
-
195
-
196
-
197
-
198
-
199
-
200
-
201
-
202
-
203
-
204
-
205
-
206
-
207
-
208
-
209
-
210
-
211
-
212
-
213
-
214
-
215
-
216
-
217
-
218
-
219
-
220
-
221
-
222
-
223
-
224
-
225
-
226
-
227
-
228
-
229
-
230
-
231
-
232
-
233
-
234
-
235
-
236
-
237
-
238
-
239
-
240
-
241
-
242
-
243
-
244
-
245
-
246
-
247
-
248
-
249
-
250
-
251
-
252
-
253
-
254
-
255
 |
 |

41
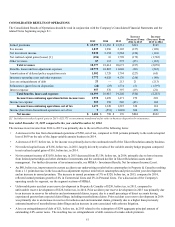
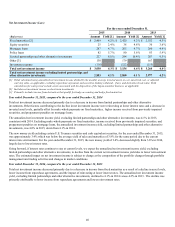
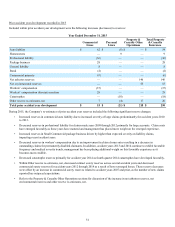
Net Realized Capital Gains (Losses)
For the years ended December 31,
(Before tax) 2015 2014 2013
Gross gains on sales [1] $ 460 $ 527 $ 2,313
Gross losses on sales (405)(250) (659)
Net other-than-temporary impairment ("OTTI") losses recognized in earnings (102)(59) (73)
Valuation allowances on mortgage loans (5)(4) (1)
Periodic net coupon settlements on credit derivatives 11 1 (8)
Results of variable annuity hedge program
GMWB derivatives, net (87) 5 262
Macro hedge program (46)(11) (234)
Total results of variable annuity hedge program (133)(6) 28
Other, net [2] 18 (193) 198
Net realized capital gains (losses) $ (156) $ 16 $ 1,798
[1] Includes $1.5 billion of gains relating to the sales of the Retirement Plans and Individual Life businesses in the year ended December 31, 2013.
[2] Primarily consists of changes in value of non-qualifying derivatives, including credit derivatives, interest rate derivatives used to manage duration,
and the yen denominated fixed payout annuity hedge.
Details on the Company’s net realized capital gains and losses are as follows:
Gross Gains and Losses on Sales
• Gross gains on sales for the year ended December 31, 2015, were primarily due to gains on the sale of corporate, U.S. treasury, and
equity securities. Gross losses on sales for the year ended December 31, 2015, were primarily the result of losses on the sale of
corporate, equity and U.S. treasury securities. The sales were primarily a result of duration, liquidity and credit management, as well
as tactical changes to the portfolio as a result of changing market conditions, including sales to reduce exposure to energy, emerging
markets and other below investment grade corporate securities.
• Gross gains on sales for the year ended December 31, 2014, were primarily due to gains on the sale of corporate securities, CMBS,
RMBS, and municipal securities. Gross losses on sales for the year ended December 31, 2014, were primarily the result of losses on
the sale of corporate and foreign government and government agency securities, which included sales resulting from a reduction in
our exposure to the emerging market and energy sector securities as well as other portfolio management activities. The sales were
primarily a result of duration, liquidity and credit management, as well as tactical changes to the portfolio as a result of changing
market conditions.
• Gross gains on sales for the year ended December 31, 2013, were predominately from the sale of the Retirement Plans and
Individual Life businesses resulting in a gain of $1.5 billion. The remaining gains on sales were primarily due to the sales of
corporate securities and tax-exempt municipals. Gross losses on sales were primarily the result of the sales of U.S. Treasuries and
mortgage backed securities, predominantly due to duration, liquidity and credit management as well as progress towards sector
allocation objectives.
Net OTTI Losses
• See Other-Than-Temporary Impairments within the Investment Portfolio Risks and Risk Management section of the MD&A.
Valuation Allowances on Mortgage Loans
• See Valuation Allowances on Mortgage Loans within the Investment Portfolio Risks and Risk Management section of the MD&A.
Variable Annuity Hedge Program
• For the year ended December 31, 2015, the loss related to the combined GMWB derivatives, net, which include the GMWB
product, reinsurance, and hedging derivatives, was primarily driven by losses of $42 due to liability/model assumption updates, and
losses of $18 resulting from an underperformance of the underlying actively managed funds compared to their respective indices.
The loss on the macro hedge program for the year ended December 31, 2015 was primarily due to a loss of $44 driven by time
decay on options.