The Hartford 2015 Annual Report Download - page 79
Download and view the complete annual report
Please find page 79 of the 2015 The Hartford annual report below. You can navigate through the pages in the report by either clicking on the pages listed below, or by using the keyword search tool below to find specific information within the annual report.-
 1
1 -
2
-
3
-
4
-
5
-
6
-
7
-
8
-
9
-
10
-
11
-
12
-
13
-
14
-
15
-
16
-
17
-
18
-
19
-
20
-
21
-
22
-
23
-
24
-
25
-
26
-
27
-
28
-
29
-
30
-
31
-
32
-
33
-
34
-
35
-
36
-
37
-
38
-
39
-
40
-
41
-
42
-
43
-
44
-
45
-
46
-
47
-
48
-
49
-
50
-
51
-
52
-
53
-
54
-
55
-
56
-
57
-
58
-
59
-
60
-
61
-
62
-
63
-
64
-
65
-
66
-
67
-
68
-
 69
69 -
 70
70 -
 71
71 -
 72
72 -
 73
73 -
 74
74 -
 75
75 -
 76
76 -
 77
77 -
 78
78 -
 79
79 -
 80
80 -
 81
81 -
 82
82 -
 83
83 -
 84
84 -
 85
85 -
 86
86 -
 87
87 -
 88
88 -
 89
89 -
90
-
91
-
92
-
93
-
94
-
95
-
96
-
97
-
98
-
99
-
100
-
101
-
102
-
103
-
104
-
105
-
106
-
107
-
108
-
109
-
110
-
111
-
112
-
113
-
114
-
115
-
116
-
117
-
118
-
119
-
120
-
121
-
122
-
123
-
124
-
125
-
126
-
127
-
128
-
129
-
130
-
131
-
132
-
133
-
134
-
135
-
136
-
137
-
138
-
139
-
140
-
141
-
142
-
143
-
144
-
145
-
146
-
147
-
148
-
149
-
150
-
151
-
152
-
153
-
154
-
155
-
156
-
157
-
158
-
159
-
160
-
161
-
162
-
163
-
164
-
165
-
166
-
167
-
168
-
169
-
170
-
171
-
172
-
173
-
174
-
175
-
176
-
177
-
178
-
179
-
180
-
181
-
182
-
183
-
184
-
185
-
186
-
187
-
188
-
189
-
190
-
191
-
192
-
193
-
194
-
195
-
196
-
197
-
198
-
199
-
200
-
201
-
202
-
203
-
204
-
205
-
206
-
207
-
208
-
209
-
210
-
211
-
212
-
213
-
214
-
215
-
216
-
217
-
218
-
219
-
220
-
221
-
222
-
223
-
224
-
225
-
226
-
227
-
228
-
229
-
230
-
231
-
232
-
233
-
234
-
235
-
236
-
237
-
238
-
239
-
240
-
241
-
242
-
243
-
244
-
245
-
246
-
247
-
248
-
249
-
250
-
251
-
252
-
253
-
254
-
255
 |
 |
79
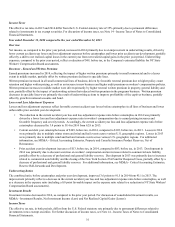
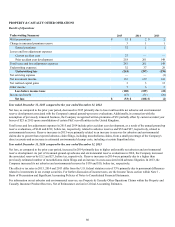
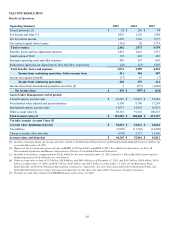
Year ended December 31, 2014 compared to the year ended December 31, 2013
Overview
Net income, as compared to the prior year period, decreased in 2014 primarily due to a change to net realized capital losses and a
decrease in net servicing income, partially offset by improvements in underwriting results, driven by higher earned premiums and lower
underwriting expenses.
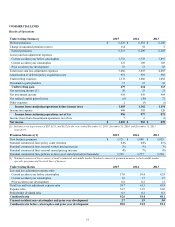
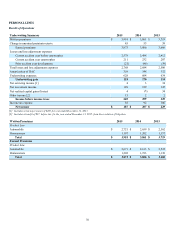
Revenues - Earned and Written Premiums
Earned and written premiums increased in 2014 reflecting new business written premium growth in auto, primarily from AARP Direct
and AARP Agency, improved earned pricing increases in both auto and homeowners, and continued high levels of premium retention.
Losses and Loss Adjustment Expenses
Losses and loss adjustment expenses reflect an increase in current accident year loss and loss adjustment expenses before catastrophes
and higher current accident year catastrophes, partially offset by higher favorable prior accident year development.
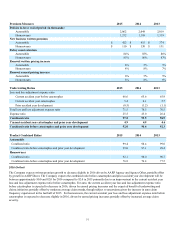
• Current accident year losses and loss adjustment expenses before catastrophes increased in 2014 compared to 2013 driven by
growth in earned premium, partially offset by a decline in the current accident year loss and loss adjustment expense ratio
before catastrophes to 65.6 in 2014 from 65.9 in 2013.
• Current accident year catastrophe losses of $232, before tax, in 2014 compared to $207, before tax, in 2013. Losses in 2014
were primarily due to multiple thunderstorm and winter storm events across various U.S. geographic regions. Losses in 2013
were primarily due to multiple thunderstorm, hail and tornado events across various U.S. geographic regions. For additional
information, see MD&A - Critical Accounting Estimates, Property and Casualty Insurance Product Reserves, Net of
Reinsurance.
• Prior accident year reserve decreases of $46, before tax, in 2014 compared to $39, before tax, in 2013. Net reserve decrease in
2014 was primarily related to prior accident year catastrophes, as well as prior accident year homeowners and extra contractual
liability reserves. Net reserve decrease in 2013 was primarily related to Storm Sandy. For additional information, see MD&A -
Critical Accounting Estimates, Property and Casualty Insurance Product Reserves, Net of Reinsurance.
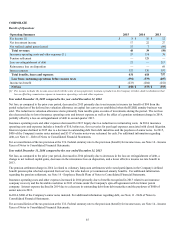
Underwriting Ratios
The combined ratio, before current accident year catastrophes and prior year development, improved to 90.6 in 2014 from 92.3 in 2013.
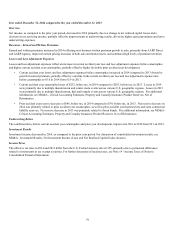
Investment Results
Investment income decreased in 2014, as compared to the prior year period. For discussion of consolidated investment results, see
MD&A - Investment Results, Net Investment Income (Loss) and Net Realized Capital Gains (Losses).
Income Taxes
The effective tax rates in 2014 and 2013 differ from the U.S. Federal statutory rate of 35% primarily due to permanent differences
related to investments in tax exempt securities. For further discussion of income taxes, see Note 14 - Income Taxes of Notes to
Consolidated Financial Statements.