The Hartford 2015 Annual Report Download - page 147
Download and view the complete annual report
Please find page 147 of the 2015 The Hartford annual report below. You can navigate through the pages in the report by either clicking on the pages listed below, or by using the keyword search tool below to find specific information within the annual report.-
 1
1 -
2
-
3
-
4
-
5
-
6
-
7
-
8
-
9
-
10
-
11
-
12
-
13
-
14
-
15
-
16
-
17
-
18
-
19
-
20
-
21
-
22
-
23
-
24
-
25
-
26
-
27
-
28
-
29
-
30
-
31
-
32
-
33
-
34
-
35
-
36
-
37
-
38
-
39
-
40
-
41
-
42
-
43
-
44
-
45
-
46
-
47
-
48
-
49
-
50
-
51
-
52
-
53
-
54
-
55
-
56
-
57
-
58
-
59
-
60
-
61
-
62
-
63
-
64
-
65
-
66
-
67
-
68
-
69
-
70
-
71
-
72
-
73
-
74
-
75
-
76
-
77
-
78
-
79
-
80
-
81
-
82
-
83
-
84
-
85
-
86
-
87
-
88
-
89
-
90
-
91
-
92
-
93
-
94
-
95
-
96
-
97
-
98
-
99
-
100
-
101
-
102
-
103
-
104
-
105
-
106
-
107
-
108
-
109
-
110
-
111
-
112
-
113
-
114
-
115
-
116
-
117
-
118
-
119
-
120
-
121
-
122
-
123
-
124
-
125
-
126
-
127
-
128
-
129
-
130
-
131
-
132
-
133
-
134
-
135
-
136
-
 137
137 -
 138
138 -
 139
139 -
 140
140 -
 141
141 -
 142
142 -
 143
143 -
 144
144 -
 145
145 -
 146
146 -
 147
147 -
 148
148 -
 149
149 -
 150
150 -
 151
151 -
 152
152 -
 153
153 -
 154
154 -
 155
155 -
 156
156 -
 157
157 -
158
-
159
-
160
-
161
-
162
-
163
-
164
-
165
-
166
-
167
-
168
-
169
-
170
-
171
-
172
-
173
-
174
-
175
-
176
-
177
-
178
-
179
-
180
-
181
-
182
-
183
-
184
-
185
-
186
-
187
-
188
-
189
-
190
-
191
-
192
-
193
-
194
-
195
-
196
-
197
-
198
-
199
-
200
-
201
-
202
-
203
-
204
-
205
-
206
-
207
-
208
-
209
-
210
-
211
-
212
-
213
-
214
-
215
-
216
-
217
-
218
-
219
-
220
-
221
-
222
-
223
-
224
-
225
-
226
-
227
-
228
-
229
-
230
-
231
-
232
-
233
-
234
-
235
-
236
-
237
-
238
-
239
-
240
-
241
-
242
-
243
-
244
-
245
-
246
-
247
-
248
-
249
-
250
-
251
-
252
-
253
-
254
-
255
 |
 |

Table of Contents THE HARTFORD FINANCIAL SERVICES GROUP, INC.
NOTES TO CONSOLIDATED FINANCIAL STATEMENTS (continued)
1. Basis of Presentation and Significant Accounting Policies (continued)
F-16
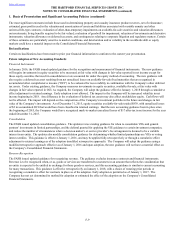
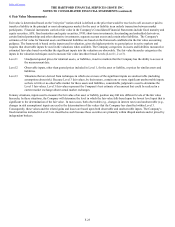
Goodwill
Goodwill represents the excess of costs over the fair value of net assets acquired. Goodwill is not amortized but is reviewed for
impairment at least annually or more frequently if events occur or circumstances change that would indicate that a triggering event for a
potential impairment has occurred. The goodwill impairment test follows a two-step process. In the first step, the fair value of a
reporting unit is compared to its carrying value. If the carrying value of a reporting unit exceeds its fair value, the second step of the
impairment test is performed for purposes of measuring the impairment. In the second step, the fair value of the reporting unit is
allocated to all of the assets and liabilities of the reporting unit to determine an implied goodwill value. If the carrying amount of the
reporting unit’s goodwill exceeds the implied goodwill value, an impairment loss is recognized in an amount equal to that excess.
Management’s determination of the fair value of each reporting unit incorporates multiple inputs into discounted cash flow calculations,
including assumptions that market participants would make in valuing the reporting unit. Assumptions include levels of economic
capital, future business growth, earnings projections and assets under management for certain reporting units and the weighted average
cost of capital used for purposes of discounting. Decreases in the amount of capital allocated to a reporting unit, decreases in business
growth, decreases in earnings projections and increases in the weighted average cost of capital will all cause a reporting unit’s fair value
to decrease, increasing the possibility of impairments.
Property and Equipment
Property and equipment which includes capitalized software is carried at cost net of accumulated depreciation and amortization.
Depreciation and amortization is based on the estimated useful lives of the various classes of property and equipment and is determined
principally on the straight-line method. Accumulated depreciation was $2.3 billion and $2.3 billion as of December 31, 2015 and 2014,
respectively. Depreciation expense was $164, $198, and $174 for the years ended December 31, 2015, 2014 and 2013, respectively.
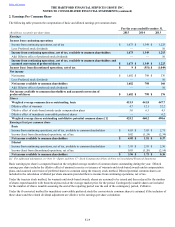
Separate Accounts, Death Benefits and Other Insurance Benefit Features
The Company records the variable account value portion of variable annuity and variable life insurance products and institutional and
governmental investment contracts within separate accounts. Separate account assets are reported at fair value and separate account
liabilities are reported at amounts consistent with separate account assets. Investment income and gains and losses from those separate
account assets accrue directly to the policyholder, who assumes the related investment risk, and are offset by change in the related
liability with changes reported in the same line item in the Consolidated Statements of Operations. The Company earns fees for
investment management, certain administrative expenses, and mortality and expense risks assumed which are reported in fee income.
Certain contracts classified as universal life-type include death and other insurance benefit features including guaranteed minimum death
benefit ("GMDB"), guaranteed minimum income benefit ("GMIB"), and guaranteed minimum withdrawal benefit ("GMWB") riders
offered with variable annuity contracts, or secondary guarantee benefits offered with universal life insurance contracts. GMWBs that
represent embedded derivatives are accounted for at fair value. Universal life insurance secondary guarantee benefits ensure that the
policy will not terminate, and will continue to provide a death benefit, even if there is insufficient policy value to cover the monthly
deductions and charges. For the Company's GMWB products, the withdrawal benefit can exceed the guaranteed remaining balance
("GRB"), which is generally equal to premiums less withdrawals. These GMDBs, GMIBs, the life-contingent portion of GMWBs and
the universal life insurance secondary guarantees require an additional liability be held above the account value liability representing the
policyholders’ funds. This liability is reported in reserve for future policy benefits in the Company’s Consolidated Balance Sheets.
Changes in the death and other insurance benefit reserves are recorded in benefits, losses and loss adjustment expenses in the Company’s
Consolidated Statements of Operations.
The death and other insurance benefit liability is determined by estimating the expected present value of the benefits in excess of the
policyholder’s expected account value in proportion to the present value of total expected fees. The liability is accrued as actual fees are
earned. The expected present value of benefits and fees are generally derived from a set of stochastic scenarios, that have been calibrated
to our RTM separate account returns, and assumptions including market rates of return, volatility, discount rates, lapse rates and
mortality experience. Consistent with the Company’s policy on the Unlock, the Company regularly evaluates estimates used and adjusts
the additional liability balance, with a related charge or credit to benefits, losses and loss adjustment expense. For further information on
the Unlock, see the Deferred Policy Acquisition Costs accounting policy section within this footnote.
The Company reinsures a portion of its in-force GMDB and all of its universal life insurance secondary guarantees and net reinsurance
costs are recognized ratably over the accumulation period based on total expected assessments.