The Hartford 2015 Annual Report Download - page 69
Download and view the complete annual report
Please find page 69 of the 2015 The Hartford annual report below. You can navigate through the pages in the report by either clicking on the pages listed below, or by using the keyword search tool below to find specific information within the annual report.-
 1
1 -
2
-
3
-
4
-
5
-
6
-
7
-
8
-
9
-
10
-
11
-
12
-
13
-
14
-
15
-
16
-
17
-
18
-
19
-
20
-
21
-
22
-
23
-
24
-
25
-
26
-
27
-
28
-
29
-
30
-
31
-
32
-
33
-
34
-
35
-
36
-
37
-
38
-
39
-
40
-
41
-
42
-
43
-
44
-
45
-
46
-
47
-
48
-
49
-
50
-
51
-
52
-
53
-
54
-
55
-
56
-
57
-
58
-
 59
59 -
 60
60 -
 61
61 -
 62
62 -
 63
63 -
 64
64 -
 65
65 -
 66
66 -
 67
67 -
 68
68 -
 69
69 -
 70
70 -
 71
71 -
 72
72 -
 73
73 -
 74
74 -
 75
75 -
 76
76 -
 77
77 -
 78
78 -
 79
79 -
80
-
81
-
82
-
83
-
84
-
85
-
86
-
87
-
88
-
89
-
90
-
91
-
92
-
93
-
94
-
95
-
96
-
97
-
98
-
99
-
100
-
101
-
102
-
103
-
104
-
105
-
106
-
107
-
108
-
109
-
110
-
111
-
112
-
113
-
114
-
115
-
116
-
117
-
118
-
119
-
120
-
121
-
122
-
123
-
124
-
125
-
126
-
127
-
128
-
129
-
130
-
131
-
132
-
133
-
134
-
135
-
136
-
137
-
138
-
139
-
140
-
141
-
142
-
143
-
144
-
145
-
146
-
147
-
148
-
149
-
150
-
151
-
152
-
153
-
154
-
155
-
156
-
157
-
158
-
159
-
160
-
161
-
162
-
163
-
164
-
165
-
166
-
167
-
168
-
169
-
170
-
171
-
172
-
173
-
174
-
175
-
176
-
177
-
178
-
179
-
180
-
181
-
182
-
183
-
184
-
185
-
186
-
187
-
188
-
189
-
190
-
191
-
192
-
193
-
194
-
195
-
196
-
197
-
198
-
199
-
200
-
201
-
202
-
203
-
204
-
205
-
206
-
207
-
208
-
209
-
210
-
211
-
212
-
213
-
214
-
215
-
216
-
217
-
218
-
219
-
220
-
221
-
222
-
223
-
224
-
225
-
226
-
227
-
228
-
229
-
230
-
231
-
232
-
233
-
234
-
235
-
236
-
237
-
238
-
239
-
240
-
241
-
242
-
243
-
244
-
245
-
246
-
247
-
248
-
249
-
250
-
251
-
252
-
253
-
254
-
255
 |
 |
69
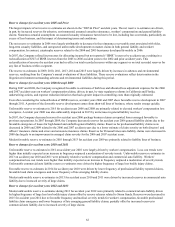
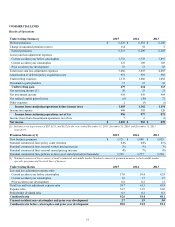
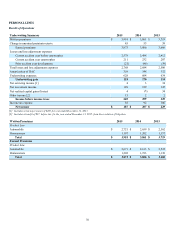
A reconciliation of net income to core earnings is set forth in the following table:
For the years ended December 31,
2015 2014 2013
Net income $ 1,682 $ 798 $ 176
Less: Unlock benefit (charge), after-tax 52 (62) (109)
Less: Net realized capital gains (losses), after-tax and DAC, excluded from core earnings [1] (114)(20) 121
Less: Restructuring and other costs, after-tax (13)(49) (44)
Less: Pension settlement, after-tax — (83) —
Less: Loss on extinguishment of debt, after-tax (14) — (138)
Less: Net reinsurance gain (loss) on dispositions, after-tax 18 15 (24)
Less: Income tax benefit from reduction in valuation allowance 94 — —
Less: Income (loss) from discontinued operations, after-tax 9(551) (1,049)
Core earnings $ 1,650 $ 1,548 $ 1,419
[1] Excludes net realized gain on dispositions of $1.0 billion, after-tax, for the year ended December 31, 2013 relating to the sales of the Retirement
Plans and Individual Life businesses which are included in net reinsurance loss on dispositions, after-tax.
Core Earnings Margin
Core earnings margin is a non-GAAP financial measure that the Company uses to evaluate, and believes is an important measure of, the
Group Benefits segment’s operating performance. Core earnings margin is calculated by dividing core earnings by revenues excluding
buyouts and realized gains (losses). Net income margin is the most directly comparable U.S. GAAP measure. The Company believes
that core earnings margin provides investors with a valuable measure of the performance of Group Benefits because it reveals trends in
the business that may be obscured by the effect of buyouts and realized gains (losses). Core earnings margin should not be considered as
a substitute for net income margin and does not reflect the overall profitability of Group Benefits. Therefore, the Company believes it is
important for investors to evaluate both core earnings margin and net income margin when reviewing performance. A reconciliation of
net income margin to core earnings margin for the years ended December 31, 2015, 2014 and 2013 is set forth in the Margin section
within MD&A - Group Benefits.
Current Accident Year Loss and Loss Adjustment Expense Ratio before Catastrophes
The current accident year loss and loss adjustment expense ratio before catastrophes is a measure of the cost of non-catastrophe claims
incurred in the current accident year divided by earned premiums. Management believes that the current accident year loss and loss
adjustment expense ratio before catastrophes is a performance measure that is useful to investors as it removes the impact of volatile and
unpredictable catastrophe losses and prior accident year development.
Expense Ratio
The expense ratio for the underwriting segments of Commercial Lines and Personal Lines is the ratio of underwriting expenses to earned
premiums. Underwriting expenses include the amortization of deferred policy acquisition costs and insurance operating costs and
expenses, including certain centralized services and bad debt expense. Deferred policy acquisition costs include commissions, taxes,
licenses and fees and other underwriting expenses and are amortized over the policy term.
The expense ratio for Group Benefits is expressed as the ratio of insurance operating costs and other expenses and amortization of
deferred policy acquisition costs, to premiums and other considerations, excluding buyout premiums.
Fee Income
Fee income is largely driven from amounts collected as a result of contractually defined percentages of assets under management. These
fees are generally collected on a daily basis. Therefore, the growth in assets under management either through positive net flows or net
sales, or favorable market performance will have a favorable impact on fee income. Conversely, either negative net flows or net sales, or
unfavorable market performance will reduce fee income.
Full Surrender Rates
Full surrender rates are an internal measure of contract surrenders calculated using annualized full surrenders divided by a two-point
average of annuity account values. The full surrender rate represents full contract liquidation and excludes partial withdrawals.