The Hartford 2015 Annual Report Download - page 137
Download and view the complete annual report
Please find page 137 of the 2015 The Hartford annual report below. You can navigate through the pages in the report by either clicking on the pages listed below, or by using the keyword search tool below to find specific information within the annual report.-
 1
1 -
2
-
3
-
4
-
5
-
6
-
7
-
8
-
9
-
10
-
11
-
12
-
13
-
14
-
15
-
16
-
17
-
18
-
19
-
20
-
21
-
22
-
23
-
24
-
25
-
26
-
27
-
28
-
29
-
30
-
31
-
32
-
33
-
34
-
35
-
36
-
37
-
38
-
39
-
40
-
41
-
42
-
43
-
44
-
45
-
46
-
47
-
48
-
49
-
50
-
51
-
52
-
53
-
54
-
55
-
56
-
57
-
58
-
59
-
60
-
61
-
62
-
63
-
64
-
65
-
66
-
67
-
68
-
69
-
70
-
71
-
72
-
73
-
74
-
75
-
76
-
77
-
78
-
79
-
80
-
81
-
82
-
83
-
84
-
85
-
86
-
87
-
88
-
89
-
90
-
91
-
92
-
93
-
94
-
95
-
96
-
97
-
98
-
99
-
100
-
101
-
102
-
103
-
104
-
105
-
106
-
107
-
108
-
109
-
110
-
111
-
112
-
113
-
114
-
115
-
116
-
117
-
118
-
119
-
120
-
121
-
122
-
123
-
124
-
125
-
126
-
 127
127 -
 128
128 -
 129
129 -
 130
130 -
 131
131 -
 132
132 -
 133
133 -
 134
134 -
 135
135 -
 136
136 -
 137
137 -
 138
138 -
 139
139 -
 140
140 -
 141
141 -
 142
142 -
 143
143 -
 144
144 -
 145
145 -
 146
146 -
 147
147 -
148
-
149
-
150
-
151
-
152
-
153
-
154
-
155
-
156
-
157
-
158
-
159
-
160
-
161
-
162
-
163
-
164
-
165
-
166
-
167
-
168
-
169
-
170
-
171
-
172
-
173
-
174
-
175
-
176
-
177
-
178
-
179
-
180
-
181
-
182
-
183
-
184
-
185
-
186
-
187
-
188
-
189
-
190
-
191
-
192
-
193
-
194
-
195
-
196
-
197
-
198
-
199
-
200
-
201
-
202
-
203
-
204
-
205
-
206
-
207
-
208
-
209
-
210
-
211
-
212
-
213
-
214
-
215
-
216
-
217
-
218
-
219
-
220
-
221
-
222
-
223
-
224
-
225
-
226
-
227
-
228
-
229
-
230
-
231
-
232
-
233
-
234
-
235
-
236
-
237
-
238
-
239
-
240
-
241
-
242
-
243
-
244
-
245
-
246
-
247
-
248
-
249
-
250
-
251
-
252
-
253
-
254
-
255
 |
 |
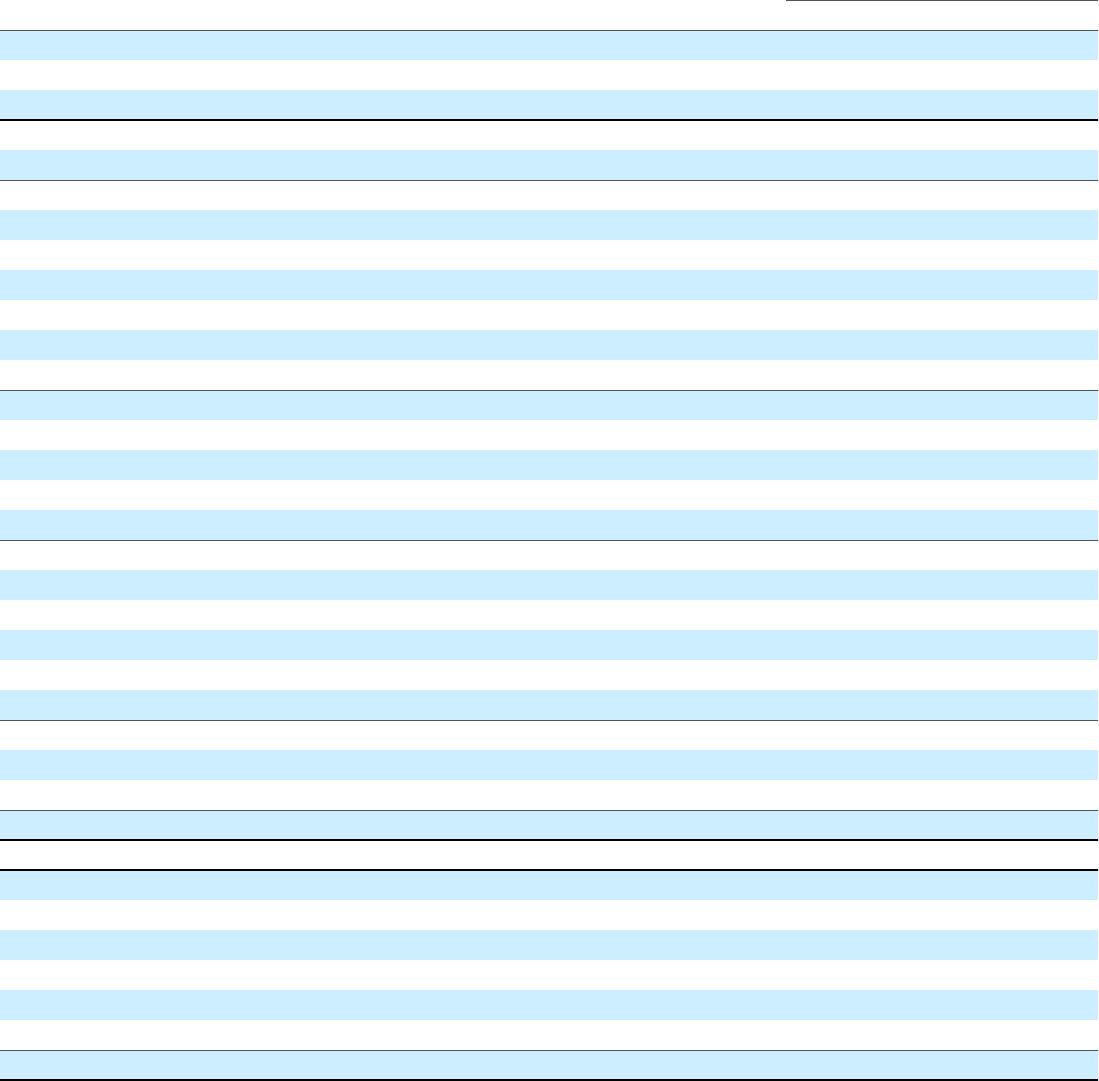
Table of Contents
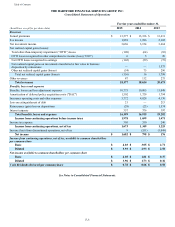
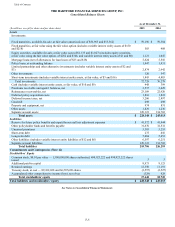
THE HARTFORD FINANCIAL SERVICES GROUP, INC.
Consolidated Statements of Changes in Stockholders' Equity
F-6
For the years ended December 31,
(In millions, except for share data) 2015 2014 2013
Preferred Stock
Balance, beginning of period $ — $ — $ 556
Conversion of shares to common stock — — (556)
Balance, end of period — — —
Common Stock 5 5 5
Additional Paid-in Capital, beginning of period 9,123 9,894 10,038
Repurchase of warrants — — (33)
Issuance of shares under incentive and stock compensation plans (165)(64) (105)
Stock-based compensation plans expense 78 88 69
Tax benefit on employee stock options and share-based awards 27 6 3
Conversion of mandatory convertible preferred stock — — 556
Issuance of shares for warrant exercise (90)(801) (634)
Additional Paid-in Capital, end of period 8,973 9,123 9,894
Retained Earnings, beginning of period 11,191 10,683 10,745
Net income 1,682 798 176
Dividends on preferred stock — — (10)
Dividends declared on common stock (323)(290) (228)
Retained Earnings, end of period 12,550 11,191 10,683
Treasury Stock, at cost, beginning of period (2,527)(1,598) (1,740)
Treasury stock acquired (1,250)(1,796) (600)
Issuance of shares under incentive and stock compensation plans 184 82 125
Net shares acquired related to employee incentive and stock compensation plans (54)(16) (17)
Issuance of shares for warrant exercise 90 801 634
Treasury Stock, at cost, end of period (3,557)(2,527) (1,598)
Accumulated Other Comprehensive Income (Loss), net of tax, beginning of period 928 (79) 2,843
Total other comprehensive income (loss) (1,257) 1,007 (2,922)
Accumulated Other Comprehensive Income (Loss), net of tax, end of period (329) 928 (79)
Total Stockholders’ Equity $ 17,642 $ 18,720 $ 18,905
Common Shares Outstanding, beginning of period (in thousands) 424,416 453,290 436,306
Treasury stock acquired (28,431)(49,518) (19,235)
Issuance of shares under incentive and stock compensation plans 4,877 2,003 2,136
Return of shares under incentive and stock compensation plans and other to treasury stock (1,311)(439) (592)
Conversion of mandatory convertible preferred shares — — 21,178
Issuance of shares for warrant exercise 2,270 19,080 13,497
Common Shares Outstanding, end of period 401,821 424,416 453,290
See Notes to Consolidated Financial Statements.