The Hartford 2015 Annual Report Download - page 40
Download and view the complete annual report
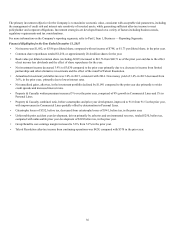
Please find page 40 of the 2015 The Hartford annual report below. You can navigate through the pages in the report by either clicking on the pages listed below, or by using the keyword search tool below to find specific information within the annual report.-
 1
1 -
2
-
3
-
4
-
5
-
6
-
7
-
8
-
9
-
10
-
11
-
12
-
13
-
14
-
15
-
16
-
17
-
18
-
19
-
20
-
21
-
22
-
23
-
24
-
25
-
26
-
27
-
28
-
29
-
 30
30 -
 31
31 -
 32
32 -
 33
33 -
 34
34 -
 35
35 -
 36
36 -
 37
37 -
 38
38 -
 39
39 -
 40
40 -
 41
41 -
 42
42 -
 43
43 -
 44
44 -
 45
45 -
 46
46 -
 47
47 -
 48
48 -
 49
49 -
 50
50 -
51
-
52
-
53
-
54
-
55
-
56
-
57
-
58
-
59
-
60
-
61
-
62
-
63
-
64
-
65
-
66
-
67
-
68
-
69
-
70
-
71
-
72
-
73
-
74
-
75
-
76
-
77
-
78
-
79
-
80
-
81
-
82
-
83
-
84
-
85
-
86
-
87
-
88
-
89
-
90
-
91
-
92
-
93
-
94
-
95
-
96
-
97
-
98
-
99
-
100
-
101
-
102
-
103
-
104
-
105
-
106
-
107
-
108
-
109
-
110
-
111
-
112
-
113
-
114
-
115
-
116
-
117
-
118
-
119
-
120
-
121
-
122
-
123
-
124
-
125
-
126
-
127
-
128
-
129
-
130
-
131
-
132
-
133
-
134
-
135
-
136
-
137
-
138
-
139
-
140
-
141
-
142
-
143
-
144
-
145
-
146
-
147
-
148
-
149
-
150
-
151
-
152
-
153
-
154
-
155
-
156
-
157
-
158
-
159
-
160
-
161
-
162
-
163
-
164
-
165
-
166
-
167
-
168
-
169
-
170
-
171
-
172
-
173
-
174
-
175
-
176
-
177
-
178
-
179
-
180
-
181
-
182
-
183
-
184
-
185
-
186
-
187
-
188
-
189
-
190
-
191
-
192
-
193
-
194
-
195
-
196
-
197
-
198
-
199
-
200
-
201
-
202
-
203
-
204
-
205
-
206
-
207
-
208
-
209
-
210
-
211
-
212
-
213
-
214
-
215
-
216
-
217
-
218
-
219
-
220
-
221
-
222
-
223
-
224
-
225
-
226
-
227
-
228
-
229
-
230
-
231
-
232
-
233
-
234
-
235
-
236
-
237
-
238
-
239
-
240
-
241
-
242
-
243
-
244
-
245
-
246
-
247
-
248
-
249
-
250
-
251
-
252
-
253
-
254
-
255
 |
 |
40
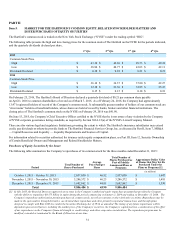
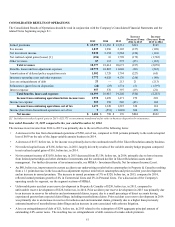
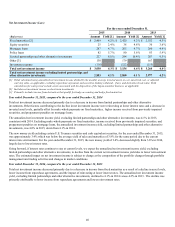
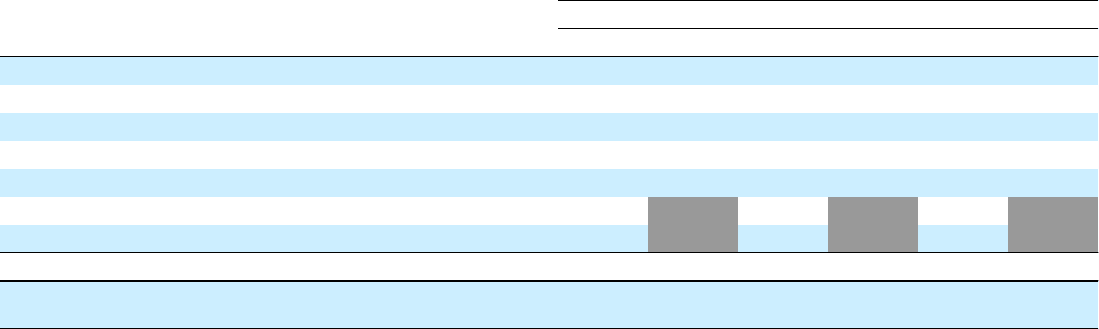
Net Investment Income (Loss)
For the years ended December 31,
2015 2014 2013
(Before tax) Amount Yield [1] Amount Yield [1] Amount Yield [1]
Fixed maturities [2] $ 2,409 4.2 % $ 2,420 4.2 % $ 2,552 4.3 %
Equity securities 25 2.4 % 38 4.8 % 30 3.6 %
Mortgage loans 267 4.7 % 265 4.7 % 260 4.9 %
Policy loans 82 5.7 % 80 5.6 % 83 5.9 %
Limited partnerships and other alternative investments 227 8.0 % 294 10.4 % 287 9.5 %
Other [3] 138 179 167
Investment expense (118)(122)(115)
Total net investment income $ 3,030 4.3% $ 3,154 4.4% $ 3,264 4.4%
Total net investment income excluding limited partnerships and
other alternative investments 2,803 4.1% 2,860 4.1% 2,977 4.2%
[1] Yields calculated using annualized net investment income divided by the monthly average invested assets at cost, amortized cost, or adjusted
carrying value, as applicable, excluding repurchase agreement and securities lending collateral , if any, and derivatives book value. Yield
calculations for each period exclude assets associated with the disposition of the Japan annuities business, as applicable.
[2] Includes net investment income on short-term investments.
[3] Primarily includes income from derivatives that qualify for hedge accounting and hedge fixed maturities.
Year ended December 31, 2015, compared to the year ended December 31, 2014
Total net investment income decreased primarily due to a decrease in income from limited partnerships and other alternative
investments. Other factors contributing to the decline in net investment income were reinvesting at lower interest rates and a decrease in
invested asset levels, partially offset by make-whole payments on fixed maturities, higher income received from previously impaired
securities, and prepayment penalties on mortgage loans.
The annualized net investment income yield, excluding limited partnerships and other alternative investments, was 4.1% in 2015,
consistent with 2014. Excluding make-whole payments on fixed maturities, income received from previously impaired securities, and
prepayment penalties on mortgage loans, the annualized investment income yield, excluding limited partnerships and other alternative
investments, was 4.0% in 2015, down from 4.1% in 2014.
The new money yield excluding certain U.S. Treasury securities and cash equivalent securities, for the year ended December 31, 2015,
was approximately 3.4% which was below the average yield of sales and maturities of 3.8% for the same period due to the current
interest rate environment. For the year ended December 31, 2015, the new money yield of 3.4% decreased slightly from 3.6% in 2014,
largely due to lower interest rates.
Going forward, if interest rates continue to stay at current levels, we expect the annualized net investment income yield, excluding
limited partnerships and other alternative investments, to decline from the current net investment income yield due to lower reinvestment
rates. The estimated impact on net investment income is subject to change as the composition of the portfolio changes through portfolio
management and trading activities and changes in market conditions.
Year ended December 31, 2014, compared to the year ended December 31, 2013
Total net investment income decreased primarily due to a decrease in income from fixed maturities as a result of a decline in asset levels,
lower income from repurchase agreements, and the impact of reinvesting at lower interest rates. The annualized net investment income
yield, excluding limited partnerships and other alternative investments, declined to 4.1% in 2014 versus 4.2% in 2013. The decline was
primarily attributable to lower income from repurchase agreements and lower reinvestment rates.