The Hartford 2015 Annual Report Download - page 171
Download and view the complete annual report
Please find page 171 of the 2015 The Hartford annual report below. You can navigate through the pages in the report by either clicking on the pages listed below, or by using the keyword search tool below to find specific information within the annual report.-
 1
1 -
2
-
3
-
4
-
5
-
6
-
7
-
8
-
9
-
10
-
11
-
12
-
13
-
14
-
15
-
16
-
17
-
18
-
19
-
20
-
21
-
22
-
23
-
24
-
25
-
26
-
27
-
28
-
29
-
30
-
31
-
32
-
33
-
34
-
35
-
36
-
37
-
38
-
39
-
40
-
41
-
42
-
43
-
44
-
45
-
46
-
47
-
48
-
49
-
50
-
51
-
52
-
53
-
54
-
55
-
56
-
57
-
58
-
59
-
60
-
61
-
62
-
63
-
64
-
65
-
66
-
67
-
68
-
69
-
70
-
71
-
72
-
73
-
74
-
75
-
76
-
77
-
78
-
79
-
80
-
81
-
82
-
83
-
84
-
85
-
86
-
87
-
88
-
89
-
90
-
91
-
92
-
93
-
94
-
95
-
96
-
97
-
98
-
99
-
100
-
101
-
102
-
103
-
104
-
105
-
106
-
107
-
108
-
109
-
110
-
111
-
112
-
113
-
114
-
115
-
116
-
117
-
118
-
119
-
120
-
121
-
122
-
123
-
124
-
125
-
126
-
127
-
128
-
129
-
130
-
131
-
132
-
133
-
134
-
135
-
136
-
137
-
138
-
139
-
140
-
141
-
142
-
143
-
144
-
145
-
146
-
147
-
148
-
149
-
150
-
151
-
152
-
153
-
154
-
155
-
156
-
157
-
158
-
159
-
160
-
 161
161 -
 162
162 -
 163
163 -
 164
164 -
 165
165 -
 166
166 -
 167
167 -
 168
168 -
 169
169 -
 170
170 -
 171
171 -
 172
172 -
 173
173 -
 174
174 -
 175
175 -
 176
176 -
 177
177 -
 178
178 -
 179
179 -
 180
180 -
 181
181 -
182
-
183
-
184
-
185
-
186
-
187
-
188
-
189
-
190
-
191
-
192
-
193
-
194
-
195
-
196
-
197
-
198
-
199
-
200
-
201
-
202
-
203
-
204
-
205
-
206
-
207
-
208
-
209
-
210
-
211
-
212
-
213
-
214
-
215
-
216
-
217
-
218
-
219
-
220
-
221
-
222
-
223
-
224
-
225
-
226
-
227
-
228
-
229
-
230
-
231
-
232
-
233
-
234
-
235
-
236
-
237
-
238
-
239
-
240
-
241
-
242
-
243
-
244
-
245
-
246
-
247
-
248
-
249
-
250
-
251
-
252
-
253
-
254
-
255
 |
 |

Table of Contents THE HARTFORD FINANCIAL SERVICES GROUP, INC.
NOTES TO CONSOLIDATED FINANCIAL STATEMENTS (continued)
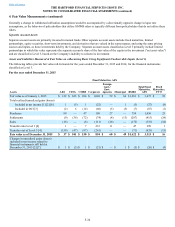
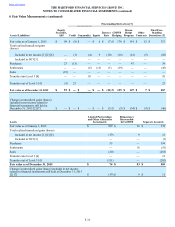
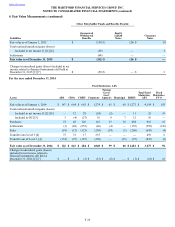
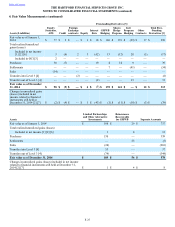
4. Fair Value Measurements (continued)
F-40
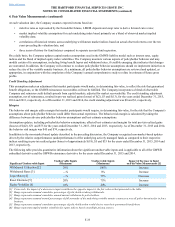
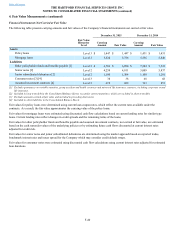
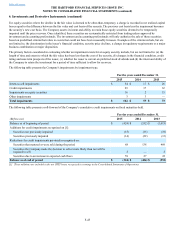
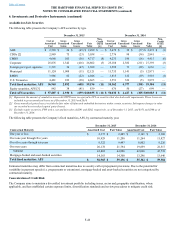
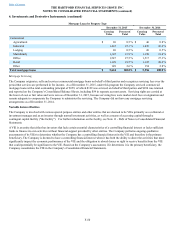
Financial Instruments Not Carried at Fair Value
The following table presents carrying amounts and fair values of the Company’s financial instruments not carried at fair value.
December 31, 2015 December 31, 2014
Fair Value
Hierarchy
Level Carrying
Amount Fair Value Carrying
Amount Fair Value
Assets
Policy loans Level 3 $ 1,447 $ 1,447 $ 1,431 $ 1,431
Mortgage loans Level 3 5,624 5,736 5,556 5,840
Liabilities
Other policyholder funds and benefits payable [1] Level 3 $ 6,706 $ 6,898 $ 7,304 $ 7,522
Senior notes [2] Level 2 4,259 4,811 5,009 5,837
Junior subordinated debentures [2] Level 2 1,100 1,304 1,100 1,291
Consumer notes [3] [4] Level 3 38 38 68 68
Assumed investment contracts [4] Level 3 619 682 763 851
[1] Excludes guarantees on variable annuities, group accident and health contracts and universal life insurance contracts, including corporate owned
life insurance.
[2] Included in long-term debt in the Consolidated Balance Sheets, except for current maturities, which are included in short-term debt.
[3] Excludes amounts carried at fair value and included in preceding disclosures.
[4] Included in other liabilities in the Consolidated Balance Sheets.
Fair values for policy loans were determined using current loan coupon rates, which reflect the current rates available under the
contracts. As a result, the fair value approximates the carrying value of the policy loans.
Fair values for mortgage loans were estimated using discounted cash flow calculations based on current lending rates for similar type
loans. Current lending rates reflect changes in credit spreads and the remaining terms of the loans.
Fair values for other policyholder funds and benefits payable and assumed investment contracts, not carried at fair value, are estimated
based on the cash surrender values of the underlying policies or by estimating future cash flows discounted at current interest rates
adjusted for credit risk.
Fair values for senior notes and junior subordinated debentures are determined using the market approach based on reported trades,
benchmark interest rates and issuer spread for the Company which may consider credit default swaps.
Fair values for consumer notes were estimated using discounted cash flow calculations using current interest rates adjusted for estimated
loan durations.