The Hartford 2015 Annual Report Download - page 150
Download and view the complete annual report
Please find page 150 of the 2015 The Hartford annual report below. You can navigate through the pages in the report by either clicking on the pages listed below, or by using the keyword search tool below to find specific information within the annual report.-
 1
1 -
2
-
3
-
4
-
5
-
6
-
7
-
8
-
9
-
10
-
11
-
12
-
13
-
14
-
15
-
16
-
17
-
18
-
19
-
20
-
21
-
22
-
23
-
24
-
25
-
26
-
27
-
28
-
29
-
30
-
31
-
32
-
33
-
34
-
35
-
36
-
37
-
38
-
39
-
40
-
41
-
42
-
43
-
44
-
45
-
46
-
47
-
48
-
49
-
50
-
51
-
52
-
53
-
54
-
55
-
56
-
57
-
58
-
59
-
60
-
61
-
62
-
63
-
64
-
65
-
66
-
67
-
68
-
69
-
70
-
71
-
72
-
73
-
74
-
75
-
76
-
77
-
78
-
79
-
80
-
81
-
82
-
83
-
84
-
85
-
86
-
87
-
88
-
89
-
90
-
91
-
92
-
93
-
94
-
95
-
96
-
97
-
98
-
99
-
100
-
101
-
102
-
103
-
104
-
105
-
106
-
107
-
108
-
109
-
110
-
111
-
112
-
113
-
114
-
115
-
116
-
117
-
118
-
119
-
120
-
121
-
122
-
123
-
124
-
125
-
126
-
127
-
128
-
129
-
130
-
131
-
132
-
133
-
134
-
135
-
136
-
137
-
138
-
139
-
 140
140 -
 141
141 -
 142
142 -
 143
143 -
 144
144 -
 145
145 -
 146
146 -
 147
147 -
 148
148 -
 149
149 -
 150
150 -
 151
151 -
 152
152 -
 153
153 -
 154
154 -
 155
155 -
 156
156 -
 157
157 -
 158
158 -
 159
159 -
 160
160 -
161
-
162
-
163
-
164
-
165
-
166
-
167
-
168
-
169
-
170
-
171
-
172
-
173
-
174
-
175
-
176
-
177
-
178
-
179
-
180
-
181
-
182
-
183
-
184
-
185
-
186
-
187
-
188
-
189
-
190
-
191
-
192
-
193
-
194
-
195
-
196
-
197
-
198
-
199
-
200
-
201
-
202
-
203
-
204
-
205
-
206
-
207
-
208
-
209
-
210
-
211
-
212
-
213
-
214
-
215
-
216
-
217
-
218
-
219
-
220
-
221
-
222
-
223
-
224
-
225
-
226
-
227
-
228
-
229
-
230
-
231
-
232
-
233
-
234
-
235
-
236
-
237
-
238
-
239
-
240
-
241
-
242
-
243
-
244
-
245
-
246
-
247
-
248
-
249
-
250
-
251
-
252
-
253
-
254
-
255
 |
 |

Table of Contents THE HARTFORD FINANCIAL SERVICES GROUP, INC.
NOTES TO CONSOLIDATED FINANCIAL STATEMENTS (continued)
2. Earnings Per Common Share
F-19
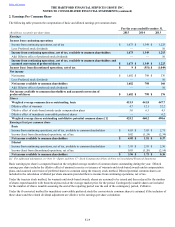
The following table presents the computation of basic and diluted earnings per common share.
For the years ended December 31,
(In millions, except for per share data) 2015 2014 2013
Earnings
Income from continuing operations
Income from continuing operations, net of tax $ 1,673 $ 1,349 $ 1,225
Less: Preferred stock dividends — — 10
Income from continuing operations, net of tax, available to common shareholders 1,673 1,349 1,215
Add: Dilutive effect of preferred stock dividends — — 10
Income from continuing operations, net of tax, available to common shareholders and
assumed conversion of preferred shares $ 1,673 $ 1,349 $ 1,225
Income (loss) from discontinued operations, net of tax $ 9 $ (551) $ (1,049)
Net income
Net income $ 1,682 $ 798 $ 176
Less: Preferred stock dividends — — 10
Net income available to common shareholders 1,682 798 166
Add: Dilutive effect of preferred stock dividends — — 10
Net income available to common shareholders and assumed conversion of
preferred shares $ 1,682 $ 798 $ 176
Shares
Weighted average common shares outstanding, basic 415.5 441.8 447.7
Dilutive effect of warrants 4.7 12.1 32.2
Dilutive effect of stock-based awards under compensation plans 5.0 6.3 4.5
Dilutive effect of mandatory convertible preferred shares — — 6.2
Weighted average shares outstanding and dilutive potential common shares [1] 425.2 460.2 490.6
Earnings (loss) per common share
Basic
Income from continuing operations, net of tax, available to common shareholders $ 4.03 $ 3.05 $ 2.71
Income (loss) from discontinued operations, net of tax 0.02 (1.24) (2.34)
Net income available to common shareholders $ 4.05 $ 1.81 $ 0.37
Diluted
Income from continuing operations, net of tax, available to common shareholders $ 3.93 $ 2.93 $ 2.50
Income (loss) from discontinued operations, net of tax 0.03 (1.20) (2.14)
Net income available to common shareholders $ 3.96 $ 1.73 $ 0.36
[1] For additional information, see Note 13 - Equity and Note 17 - Stock Compensation Plans of Notes to Consolidated Financial Statements.
Basic earnings per share is computed based on the weighted average number of common shares outstanding during the year. Diluted
earnings per share includes the dilutive effect of assumed exercise or issuance of warrants and stock-based awards under compensation
plans, and assumed conversion of preferred shares to common using the treasury stock method. Diluted potential common shares are
included in the calculation of diluted per share amounts provided there is income from continuing operations, net of tax.
Under the treasury stock method, for warrants and stock-based awards, shares are assumed to be issued and then reduced for the number
of shares repurchaseable with theoretical proceeds at the average market price for the period. Contingently issuable shares are included
for the number of shares issuable assuming the end of the reporting period was the end of the contingency period, if dilutive.
Under the if-converted method for mandatory convertible preferred stock the conversion to common shares is assumed if the inclusion of
these shares and the related dividend adjustment are dilutive to the earnings per share calculation.