The Hartford 2015 Annual Report Download - page 154
Download and view the complete annual report
Please find page 154 of the 2015 The Hartford annual report below. You can navigate through the pages in the report by either clicking on the pages listed below, or by using the keyword search tool below to find specific information within the annual report.-
 1
1 -
2
-
3
-
4
-
5
-
6
-
7
-
8
-
9
-
10
-
11
-
12
-
13
-
14
-
15
-
16
-
17
-
18
-
19
-
20
-
21
-
22
-
23
-
24
-
25
-
26
-
27
-
28
-
29
-
30
-
31
-
32
-
33
-
34
-
35
-
36
-
37
-
38
-
39
-
40
-
41
-
42
-
43
-
44
-
45
-
46
-
47
-
48
-
49
-
50
-
51
-
52
-
53
-
54
-
55
-
56
-
57
-
58
-
59
-
60
-
61
-
62
-
63
-
64
-
65
-
66
-
67
-
68
-
69
-
70
-
71
-
72
-
73
-
74
-
75
-
76
-
77
-
78
-
79
-
80
-
81
-
82
-
83
-
84
-
85
-
86
-
87
-
88
-
89
-
90
-
91
-
92
-
93
-
94
-
95
-
96
-
97
-
98
-
99
-
100
-
101
-
102
-
103
-
104
-
105
-
106
-
107
-
108
-
109
-
110
-
111
-
112
-
113
-
114
-
115
-
116
-
117
-
118
-
119
-
120
-
121
-
122
-
123
-
124
-
125
-
126
-
127
-
128
-
129
-
130
-
131
-
132
-
133
-
134
-
135
-
136
-
137
-
138
-
139
-
140
-
141
-
142
-
143
-
 144
144 -
 145
145 -
 146
146 -
 147
147 -
 148
148 -
 149
149 -
 150
150 -
 151
151 -
 152
152 -
 153
153 -
 154
154 -
 155
155 -
 156
156 -
 157
157 -
 158
158 -
 159
159 -
 160
160 -
 161
161 -
 162
162 -
 163
163 -
 164
164 -
165
-
166
-
167
-
168
-
169
-
170
-
171
-
172
-
173
-
174
-
175
-
176
-
177
-
178
-
179
-
180
-
181
-
182
-
183
-
184
-
185
-
186
-
187
-
188
-
189
-
190
-
191
-
192
-
193
-
194
-
195
-
196
-
197
-
198
-
199
-
200
-
201
-
202
-
203
-
204
-
205
-
206
-
207
-
208
-
209
-
210
-
211
-
212
-
213
-
214
-
215
-
216
-
217
-
218
-
219
-
220
-
221
-
222
-
223
-
224
-
225
-
226
-
227
-
228
-
229
-
230
-
231
-
232
-
233
-
234
-
235
-
236
-
237
-
238
-
239
-
240
-
241
-
242
-
243
-
244
-
245
-
246
-
247
-
248
-
249
-
250
-
251
-
252
-
253
-
254
-
255
 |
 |

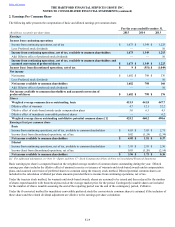
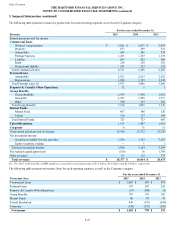
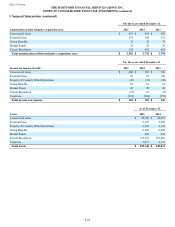
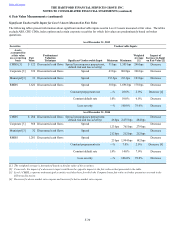
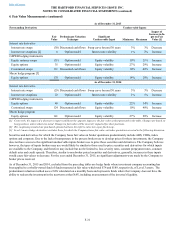
Table of Contents THE HARTFORD FINANCIAL SERVICES GROUP, INC.
NOTES TO CONSOLIDATED FINANCIAL STATEMENTS (continued)
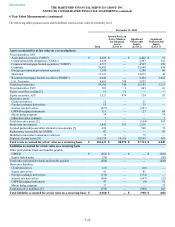
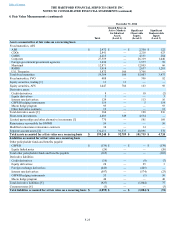
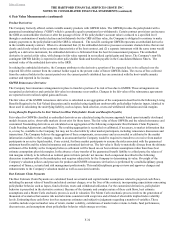
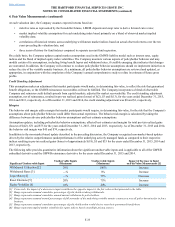
4. Fair Value Measurements
F-23
Fair value is determined based on the "exit price" notion which is defined as the price that would be received to sell an asset or paid to
transfer a liability in the principal or most advantageous market for the asset or liability in an orderly transaction between market
participants. Financial instruments carried at fair value in the Company's Consolidated Financial Statements include fixed maturity and
equity securities, AFS; fixed maturities and equity securities, FVO; short-term investments; freestanding and embedded derivatives;
certain limited partnerships and other alternative investments; separate account assets and certain other liabilities. The Company's
estimates of fair value for financial assets and financial liabilities are based on the framework established in the fair value accounting
guidance. The framework is based on the inputs used in valuation, gives the highest priority to quoted prices in active markets and
requires that observable inputs be used in the valuations when available. The Company categorizes its assets and liabilities measured at
estimated fair value based on whether the significant inputs into the valuation are observable. The fair value hierarchy categorizes the
inputs in the valuation techniques used to measure fair value into three broad Levels (Level 1, 2 or 3).
Level 1 Unadjusted quoted prices for identical assets, or liabilities, in active markets that the Company has the ability to access at
the measurement date.
Level 2 Observable inputs, other than quoted prices included in Level 1, for the asset or liability, or prices for similar assets and
liabilities.
Level 3 Valuations that are derived from techniques in which one or more of the significant inputs are unobservable (including
assumptions about risk). Because Level 3 fair values, by their nature, contain one or more significant unobservable inputs,
as there is little or no observable market for these assets and liabilities, considerable judgment is used to determine the
Level 3 fair values. Level 3 fair values represent the Company’s best estimate of an amount that could be realized in a
current market exchange absent actual market exchanges.
In many situations, inputs used to measure the fair value of an asset or liability position may fall into different levels of the fair value
hierarchy. In these situations, the Company will determine the level in which the fair value falls based upon the lowest level input that is
significant to the determination of the fair value. In most cases, both observable (e.g., changes in interest rates) and unobservable (e.g.,
changes in risk assumptions) inputs are used in the determination of fair values that the Company has classified within Level 3.
Consequently, these values and the related gains and losses are based upon both observable and unobservable inputs. The Company’s
fixed maturities included in Level 3 are classified as such because these securities are primarily within illiquid markets and/or priced by
independent brokers.