The Hartford 2015 Annual Report Download - page 165
Download and view the complete annual report
Please find page 165 of the 2015 The Hartford annual report below. You can navigate through the pages in the report by either clicking on the pages listed below, or by using the keyword search tool below to find specific information within the annual report.-
 1
1 -
2
-
3
-
4
-
5
-
6
-
7
-
8
-
9
-
10
-
11
-
12
-
13
-
14
-
15
-
16
-
17
-
18
-
19
-
20
-
21
-
22
-
23
-
24
-
25
-
26
-
27
-
28
-
29
-
30
-
31
-
32
-
33
-
34
-
35
-
36
-
37
-
38
-
39
-
40
-
41
-
42
-
43
-
44
-
45
-
46
-
47
-
48
-
49
-
50
-
51
-
52
-
53
-
54
-
55
-
56
-
57
-
58
-
59
-
60
-
61
-
62
-
63
-
64
-
65
-
66
-
67
-
68
-
69
-
70
-
71
-
72
-
73
-
74
-
75
-
76
-
77
-
78
-
79
-
80
-
81
-
82
-
83
-
84
-
85
-
86
-
87
-
88
-
89
-
90
-
91
-
92
-
93
-
94
-
95
-
96
-
97
-
98
-
99
-
100
-
101
-
102
-
103
-
104
-
105
-
106
-
107
-
108
-
109
-
110
-
111
-
112
-
113
-
114
-
115
-
116
-
117
-
118
-
119
-
120
-
121
-
122
-
123
-
124
-
125
-
126
-
127
-
128
-
129
-
130
-
131
-
132
-
133
-
134
-
135
-
136
-
137
-
138
-
139
-
140
-
141
-
142
-
143
-
144
-
145
-
146
-
147
-
148
-
149
-
150
-
151
-
152
-
153
-
154
-
 155
155 -
 156
156 -
 157
157 -
 158
158 -
 159
159 -
 160
160 -
 161
161 -
 162
162 -
 163
163 -
 164
164 -
 165
165 -
 166
166 -
 167
167 -
 168
168 -
 169
169 -
 170
170 -
 171
171 -
 172
172 -
 173
173 -
 174
174 -
 175
175 -
176
-
177
-
178
-
179
-
180
-
181
-
182
-
183
-
184
-
185
-
186
-
187
-
188
-
189
-
190
-
191
-
192
-
193
-
194
-
195
-
196
-
197
-
198
-
199
-
200
-
201
-
202
-
203
-
204
-
205
-
206
-
207
-
208
-
209
-
210
-
211
-
212
-
213
-
214
-
215
-
216
-
217
-
218
-
219
-
220
-
221
-
222
-
223
-
224
-
225
-
226
-
227
-
228
-
229
-
230
-
231
-
232
-
233
-
234
-
235
-
236
-
237
-
238
-
239
-
240
-
241
-
242
-
243
-
244
-
245
-
246
-
247
-
248
-
249
-
250
-
251
-
252
-
253
-
254
-
255
 |
 |

Table of Contents THE HARTFORD FINANCIAL SERVICES GROUP, INC.
NOTES TO CONSOLIDATED FINANCIAL STATEMENTS (continued)
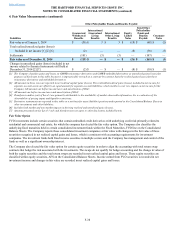
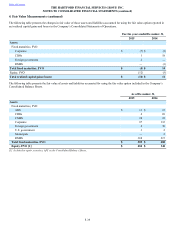
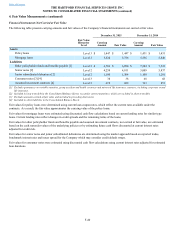
4. Fair Value Measurements (continued)
F-34
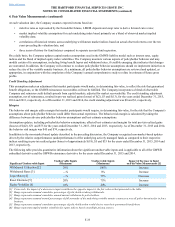
Generally a change in withdrawal utilization assumptions would be accompanied by a directionally opposite change in lapse rate
assumptions, as the behavior of policyholders that utilize GMWB riders is typically different from policyholders that do not utilize these
riders.
Separate Account Assets
Separate account assets are primarily invested in mutual funds. Other separate account assets include fixed maturities, limited
partnerships, equity securities, short-term investments, and derivatives that are valued in the same manner, and using the same pricing
sources and inputs, as those investments held by the Company. Separate account assets classified as Level 3 primarily include limited
partnerships in which fair value represents the separate account's share of the fair value of the equity in the investment ("net asset value")
and are classified in Level 3, based on the Company's inability to redeem its investment.
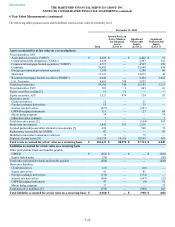
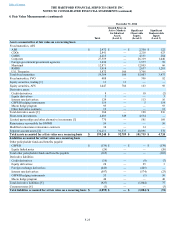
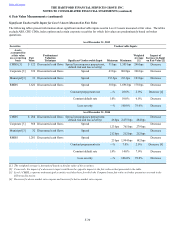
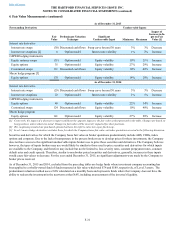
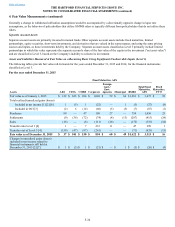
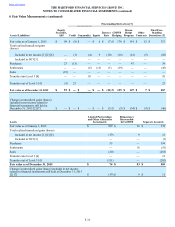
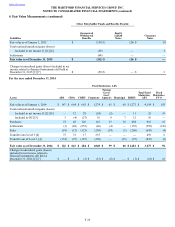
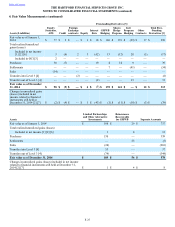
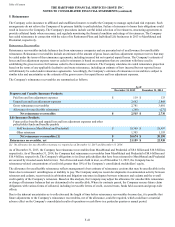
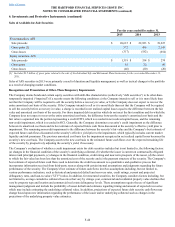
Assets and Liabilities Measured at Fair Value on a Recurring Basis Using Significant Unobservable Inputs (Level 3)
The following tables provide fair value roll-forwards for the years ended December 31, 2015 and 2014, for the financial instruments
classified as Level 3.
For the year ended December 31, 2015
Fixed Maturities, AFS
Assets ABS CDOs CMBS Corporate
Foreign
Govt./
Govt.
Agencies Municipal RMBS
Total Fixed
Maturities,
AFS
Fixed
Maturities,
FVO
Fair value as of January 1, 2015 $ 122 $ 623 $ 284 $ 1,040 $ 59 $ 66 $ 1,281 $ 3,475 $ 92
Total realized/unrealized gains (losses)
Included in net income [1] [2] [6] 1 (5) 1 (22) — 1 (3)(27) (8)
Included in OCI [3] (2) 6 (14)(60)(5)(5)(7)(87) (1)
Purchases 99 — 47 109 27 — 754 1,036 25
Settlements (9) (36) (72)(74)(4)(13)(207)(415) (24)
Sales (16) — (6)(111)(28) — (172)(333) (54)
Transfers into Level 3 [4] 1 — 7 233 11 — 47 299 1
Transfers out of Level 3 [4] (159) (47) (97)(261) — — (71)(635) (15)
Fair value as of December 31, 2015 $ 37 $ 541 $ 150 $ 854 $ 60 $ 49 $1,622 $ 3,313 $ 16
Changes in unrealized gains (losses)
included in net income related to
financial instruments still held at
December 31, 2015 [2] [7] $ 1 $ (5) $ 1 $ (21) $ — $ 1 $ (3) $ (26) $ (4)