The Hartford 2015 Annual Report Download - page 81
Download and view the complete annual report
Please find page 81 of the 2015 The Hartford annual report below. You can navigate through the pages in the report by either clicking on the pages listed below, or by using the keyword search tool below to find specific information within the annual report.-
 1
1 -
2
-
3
-
4
-
5
-
6
-
7
-
8
-
9
-
10
-
11
-
12
-
13
-
14
-
15
-
16
-
17
-
18
-
19
-
20
-
21
-
22
-
23
-
24
-
25
-
26
-
27
-
28
-
29
-
30
-
31
-
32
-
33
-
34
-
35
-
36
-
37
-
38
-
39
-
40
-
41
-
42
-
43
-
44
-
45
-
46
-
47
-
48
-
49
-
50
-
51
-
52
-
53
-
54
-
55
-
56
-
57
-
58
-
59
-
60
-
61
-
62
-
63
-
64
-
65
-
66
-
67
-
68
-
69
-
70
-
 71
71 -
 72
72 -
 73
73 -
 74
74 -
 75
75 -
 76
76 -
 77
77 -
 78
78 -
 79
79 -
 80
80 -
 81
81 -
 82
82 -
 83
83 -
 84
84 -
 85
85 -
 86
86 -
 87
87 -
 88
88 -
 89
89 -
 90
90 -
 91
91 -
92
-
93
-
94
-
95
-
96
-
97
-
98
-
99
-
100
-
101
-
102
-
103
-
104
-
105
-
106
-
107
-
108
-
109
-
110
-
111
-
112
-
113
-
114
-
115
-
116
-
117
-
118
-
119
-
120
-
121
-
122
-
123
-
124
-
125
-
126
-
127
-
128
-
129
-
130
-
131
-
132
-
133
-
134
-
135
-
136
-
137
-
138
-
139
-
140
-
141
-
142
-
143
-
144
-
145
-
146
-
147
-
148
-
149
-
150
-
151
-
152
-
153
-
154
-
155
-
156
-
157
-
158
-
159
-
160
-
161
-
162
-
163
-
164
-
165
-
166
-
167
-
168
-
169
-
170
-
171
-
172
-
173
-
174
-
175
-
176
-
177
-
178
-
179
-
180
-
181
-
182
-
183
-
184
-
185
-
186
-
187
-
188
-
189
-
190
-
191
-
192
-
193
-
194
-
195
-
196
-
197
-
198
-
199
-
200
-
201
-
202
-
203
-
204
-
205
-
206
-
207
-
208
-
209
-
210
-
211
-
212
-
213
-
214
-
215
-
216
-
217
-
218
-
219
-
220
-
221
-
222
-
223
-
224
-
225
-
226
-
227
-
228
-
229
-
230
-
231
-
232
-
233
-
234
-
235
-
236
-
237
-
238
-
239
-
240
-
241
-
242
-
243
-
244
-
245
-
246
-
247
-
248
-
249
-
250
-
251
-
252
-
253
-
254
-
255
 |
 |

81
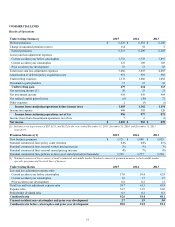
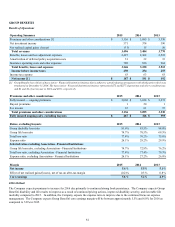
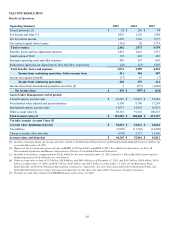
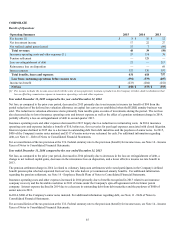
GROUP BENEFITS
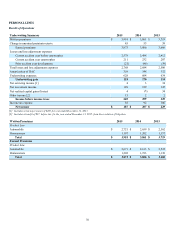
Results of Operations
Operating Summary 2015 2014 2013
Premiums and other considerations [1] $ 3,136 $ 3,095 $ 3,330
Net investment income 371 374 390
Net realized capital gains (losses) (11) 15 50
Total revenues 3,496 3,484 3,770
Benefits, losses and loss adjustment expenses 2,427 2,362 2,518
Amortization of deferred policy acquisition costs 31 32 33
Insurance operating costs and other expenses 788 836 964
Total benefits, losses and expenses 3,246 3,230 3,515
Income before income taxes 250 254 255
Income tax expense 63 63 63
Net income [1] $ 187 $ 191 $ 192
[1] Group Benefits has a block of Association - Financial Institution business that is subject to a profit sharing arrangement with third parties which was
terminated on December 31,2014. The Association - Financial Institutions business represented $72 and $277 of premiums and other considerations,
and $1 and $1 of net income in 2014 and 2013, respectively.
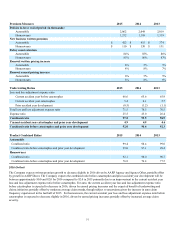
Premiums and other considerations 2015 2014 2013
Fully insured — ongoing premiums $ 3,068 $ 3,014 $ 3,272
Buyout premiums 1 20 1
Fee income 67 61 57
Total premiums and other considerations 3,136 3,095 3,330
Fully insured ongoing sales, excluding buyouts $ 467 $ 326 $ 393
Ratios, excluding buyouts 2015 2014 2013
Group disability loss ratio 81.6% 83.5% 84.0%
Group life loss ratio 74.7% 70.5% 69.5%
Total loss ratio 77.4% 76.2% 75.6%
Expense ratio 26.1% 28.2% 29.9%
Selected ratios excluding Association - Financial Institutions
Group life loss ratio, excluding Association - Financial Institutions 74.7% 72.8% 76.2%
Total loss ratio, excluding Association - Financial Institutions 77.4% 77.4% 79.3%
Expense ratio, excluding Association - Financial Institutions 26.1% 27.2% 26.8%
Margin 2015 2014 2013
Net income 5.4% 5.5% 5.1%
Effect of net realized gains/(losses), net of tax on after-tax margin (0.2)% 0.3 % 0.8 %
Core earnings 5.6% 5.2% 4.3%
2016 Outlook
The Company expects premiums to increase for 2016 due primarily to continued strong book persistency. The Company expects Group
Benefits' disability and life results to improve as a result of continued pricing actions, improved disability severity, and favorable life
mortality compared to 2015. In addition, the Company expects the expense ratio to improve due to the continued focus on expense
management. The Company expects Group Benefits' core earnings margin will be between approximately 5.5% and 6.0% for 2016 as
compared to 5.6% in 2015.