The Hartford 2015 Annual Report Download - page 123
Download and view the complete annual report
Please find page 123 of the 2015 The Hartford annual report below. You can navigate through the pages in the report by either clicking on the pages listed below, or by using the keyword search tool below to find specific information within the annual report.-
 1
1 -
2
-
3
-
4
-
5
-
6
-
7
-
8
-
9
-
10
-
11
-
12
-
13
-
14
-
15
-
16
-
17
-
18
-
19
-
20
-
21
-
22
-
23
-
24
-
25
-
26
-
27
-
28
-
29
-
30
-
31
-
32
-
33
-
34
-
35
-
36
-
37
-
38
-
39
-
40
-
41
-
42
-
43
-
44
-
45
-
46
-
47
-
48
-
49
-
50
-
51
-
52
-
53
-
54
-
55
-
56
-
57
-
58
-
59
-
60
-
61
-
62
-
63
-
64
-
65
-
66
-
67
-
68
-
69
-
70
-
71
-
72
-
73
-
74
-
75
-
76
-
77
-
78
-
79
-
80
-
81
-
82
-
83
-
84
-
85
-
86
-
87
-
88
-
89
-
90
-
91
-
92
-
93
-
94
-
95
-
96
-
97
-
98
-
99
-
100
-
101
-
102
-
103
-
104
-
105
-
106
-
107
-
108
-
109
-
110
-
111
-
112
-
 113
113 -
 114
114 -
 115
115 -
 116
116 -
 117
117 -
 118
118 -
 119
119 -
 120
120 -
 121
121 -
 122
122 -
 123
123 -
 124
124 -
 125
125 -
 126
126 -
 127
127 -
 128
128 -
 129
129 -
 130
130 -
 131
131 -
 132
132 -
 133
133 -
134
-
135
-
136
-
137
-
138
-
139
-
140
-
141
-
142
-
143
-
144
-
145
-
146
-
147
-
148
-
149
-
150
-
151
-
152
-
153
-
154
-
155
-
156
-
157
-
158
-
159
-
160
-
161
-
162
-
163
-
164
-
165
-
166
-
167
-
168
-
169
-
170
-
171
-
172
-
173
-
174
-
175
-
176
-
177
-
178
-
179
-
180
-
181
-
182
-
183
-
184
-
185
-
186
-
187
-
188
-
189
-
190
-
191
-
192
-
193
-
194
-
195
-
196
-
197
-
198
-
199
-
200
-
201
-
202
-
203
-
204
-
205
-
206
-
207
-
208
-
209
-
210
-
211
-
212
-
213
-
214
-
215
-
216
-
217
-
218
-
219
-
220
-
221
-
222
-
223
-
224
-
225
-
226
-
227
-
228
-
229
-
230
-
231
-
232
-
233
-
234
-
235
-
236
-
237
-
238
-
239
-
240
-
241
-
242
-
243
-
244
-
245
-
246
-
247
-
248
-
249
-
250
-
251
-
252
-
253
-
254
-
255
 |
 |
123
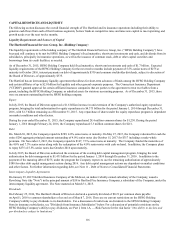
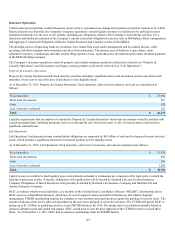
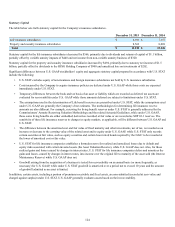
Cash provided by investing activities in 2014 primarily relates to net proceeds from available-for-sale securities of $2.8 billion, and
proceeds from the business sold of $963, partially offset by net payments for short-term investments of $1.8 billion. Cash provided by
investing activities in 2013 primarily relates to net proceeds from the sale of available-for-sale securities of $4.9 billion, and proceeds
from the business sold of $815, partially offset by net payments on derivatives of $2.2 billion.
Cash used for financing activities in 2014 primarily relates to $2.2 billion related to net payments for deposits, transfers and withdrawals
for investment and universal life products and treasury stock acquired of $1.8 billion. Cash used for financing activities in 2013
primarily consists of net payments for deposits, transfers and withdrawals for investment and universal life products of $2.1 billion, a
decrease in securities loaned or sold under agreements to repurchase of $1.9 billion, repayment of long term debt of $1.3 billion and
treasury stock acquired of $600.
Equity Markets
For a discussion of the potential impact of the equity markets on capital and liquidity, see the Financial Risk on Statutory Capital and
Liquidity Risk section in this MD&A.
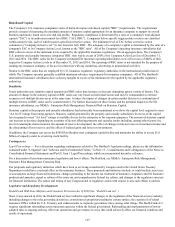
Ratings
Ratings are an important factor in establishing a competitive position in the insurance marketplace and impact the Company's ability to
access financing and its cost of borrowing. There can be no assurance that the Company’s ratings will continue for any given period of
time, or that they will not be changed. In the event the Company’s ratings are downgraded, the Company’s competitive position, ability
to access financing, and its cost of borrowing, may be adversely impacted.
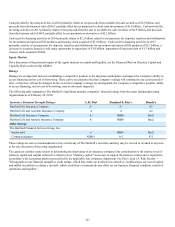
The following table summarizes The Hartford’s significant member companies’ financial ratings from the major independent rating
organizations as of February 24, 2016:
Insurance Financial Strength Ratings: A.M. Best Standard & Poor's Moody's
Hartford Fire Insurance Company A+ A+ A1
Hartford Life and Accident Insurance Company A A A2
Hartford Life Insurance Company A- BBB+ Baa2
Hartford Life and Annuity Insurance Company A- BBB+ Baa2
Other Ratings:
The Hartford Financial Services Group, Inc.:
Senior debt a- BBB + Baa2
Commercial paper AMB-1 A-2 P-2
These ratings are not a recommendation to buy or hold any of The Hartford’s securities and they may be revised or revoked at any time
at the sole discretion of the rating organization.
The agencies consider many factors in determining the final rating of an insurance company. One consideration is the relative level of
statutory capital and surplus (referred to collectively as "statutory capital") necessary to support the business written and is reported in
accordance with accounting practices prescribed by the applicable state insurance department. See Part I, Item 1A. Risk Factors —
“Downgrades in our financial strength or credit ratings, which may make our products less attractive, could increase our cost of capital
and inhibit our ability to refinance our debt, which would have a material adverse effect on our business, financial condition, results of
operations and liquidity.”