The Hartford 2015 Annual Report Download - page 174
Download and view the complete annual report
Please find page 174 of the 2015 The Hartford annual report below. You can navigate through the pages in the report by either clicking on the pages listed below, or by using the keyword search tool below to find specific information within the annual report.-
 1
1 -
2
-
3
-
4
-
5
-
6
-
7
-
8
-
9
-
10
-
11
-
12
-
13
-
14
-
15
-
16
-
17
-
18
-
19
-
20
-
21
-
22
-
23
-
24
-
25
-
26
-
27
-
28
-
29
-
30
-
31
-
32
-
33
-
34
-
35
-
36
-
37
-
38
-
39
-
40
-
41
-
42
-
43
-
44
-
45
-
46
-
47
-
48
-
49
-
50
-
51
-
52
-
53
-
54
-
55
-
56
-
57
-
58
-
59
-
60
-
61
-
62
-
63
-
64
-
65
-
66
-
67
-
68
-
69
-
70
-
71
-
72
-
73
-
74
-
75
-
76
-
77
-
78
-
79
-
80
-
81
-
82
-
83
-
84
-
85
-
86
-
87
-
88
-
89
-
90
-
91
-
92
-
93
-
94
-
95
-
96
-
97
-
98
-
99
-
100
-
101
-
102
-
103
-
104
-
105
-
106
-
107
-
108
-
109
-
110
-
111
-
112
-
113
-
114
-
115
-
116
-
117
-
118
-
119
-
120
-
121
-
122
-
123
-
124
-
125
-
126
-
127
-
128
-
129
-
130
-
131
-
132
-
133
-
134
-
135
-
136
-
137
-
138
-
139
-
140
-
141
-
142
-
143
-
144
-
145
-
146
-
147
-
148
-
149
-
150
-
151
-
152
-
153
-
154
-
155
-
156
-
157
-
158
-
159
-
160
-
161
-
162
-
163
-
 164
164 -
 165
165 -
 166
166 -
 167
167 -
 168
168 -
 169
169 -
 170
170 -
 171
171 -
 172
172 -
 173
173 -
 174
174 -
 175
175 -
 176
176 -
 177
177 -
 178
178 -
 179
179 -
 180
180 -
 181
181 -
 182
182 -
 183
183 -
 184
184 -
185
-
186
-
187
-
188
-
189
-
190
-
191
-
192
-
193
-
194
-
195
-
196
-
197
-
198
-
199
-
200
-
201
-
202
-
203
-
204
-
205
-
206
-
207
-
208
-
209
-
210
-
211
-
212
-
213
-
214
-
215
-
216
-
217
-
218
-
219
-
220
-
221
-
222
-
223
-
224
-
225
-
226
-
227
-
228
-
229
-
230
-
231
-
232
-
233
-
234
-
235
-
236
-
237
-
238
-
239
-
240
-
241
-
242
-
243
-
244
-
245
-
246
-
247
-
248
-
249
-
250
-
251
-
252
-
253
-
254
-
255
 |
 |

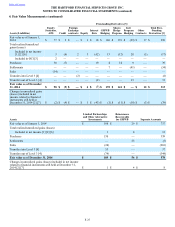
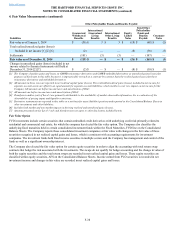
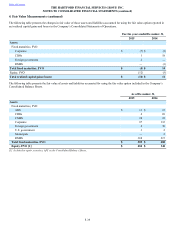
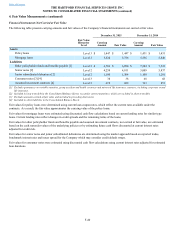
Table of Contents THE HARTFORD FINANCIAL SERVICES GROUP, INC.
NOTES TO CONSOLIDATED FINANCIAL STATEMENTS (continued)
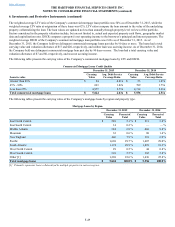
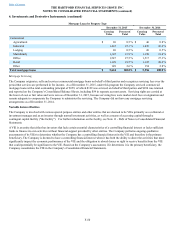
6. Investments and Derivative Instruments
F-43
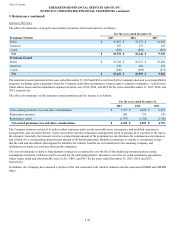
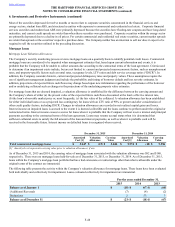
Net Investment Income (Loss)
For the years ended December 31,
(Before-tax) 2015 2014 2013
Fixed maturities [1] $ 2,409 $ 2,420 $ 2,552
Equity securities 25 38 30
Mortgage loans 267 265 260
Policy loans 82 80 83
Limited partnerships and other alternative investments 227 294 287
Other investments [2] 138 179 167
Investment expenses (118)(122) (115)
Total net investment income $ 3,030 $ 3,154 $ 3,264
[1] Includes net investment income on short-term investments.
[2] Includes income from derivatives that hedge fixed maturities and qualify for hedge accounting.
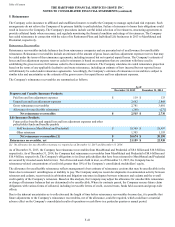
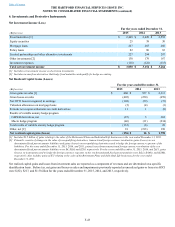
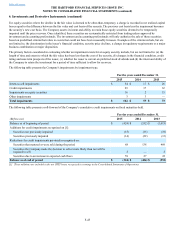
Net Realized Capital Gains (Losses)
For the years ended December 31,
(Before-tax) 2015 2014 2013
Gross gains on sales [1] $ 460 $ 527 $ 2,313
Gross losses on sales (405)(250) (659)
Net OTTI losses recognized in earnings (102)(59) (73)
Valuation allowances on mortgage loans (5)(4) (1)
Periodic net coupon settlements on credit derivatives 11 1 (8)
Results of variable annuity hedge program
GMWB derivatives, net (87) 5 262
Macro hedge program (46)(11) (234)
Total results of variable annuity hedge program (133)(6) 28
Other, net [2] 18 (193) 198
Net realized capital gains (losses) $ (156) $ 16 $ 1,798
[1] Includes $1.5 billion of gains relating to the sales of the Retirement Plans and Individual Life businesses in the year ended December 31, 2013.
[2] Primarily consists of changes in the value of non-qualifying derivatives, transactional foreign currency revaluation gains (losses) on yen
denominated fixed payout annuity liabilities and gains (losses) on non-qualifying derivatives used to hedge the foreign currency exposure of the
liabilities. For the years ended December 31, 2015, 2014, and 2013, gains (losses) from transactional foreign currency revaluation of the yen
denominated fixed payout annuity liabilities were $4, $116, and $250, respectively. For the years ended December 31, 2015, 2014, and 2013, gains
(losses) on instruments used to hedge the foreign currency exposure on the yen denominated fixed payout annuities were $(21), $(148), and $(268),
respectively. Also includes gains of $71 relating to the sales of the Retirement Plans and Individual Life businesses for the year ended
December 31, 2013.
Net realized capital gains and losses from investment sales are reported as a component of revenues and are determined on a specific
identification basis. Before tax, net gains and losses on sales and impairments previously reported as unrealized gains or losses in AOCI
were $(32), $217, and $1.5 billion for the years ended December 31, 2015, 2014, and 2013, respectively.