The Hartford 2015 Annual Report Download - page 164
Download and view the complete annual report
Please find page 164 of the 2015 The Hartford annual report below. You can navigate through the pages in the report by either clicking on the pages listed below, or by using the keyword search tool below to find specific information within the annual report.-
 1
1 -
2
-
3
-
4
-
5
-
6
-
7
-
8
-
9
-
10
-
11
-
12
-
13
-
14
-
15
-
16
-
17
-
18
-
19
-
20
-
21
-
22
-
23
-
24
-
25
-
26
-
27
-
28
-
29
-
30
-
31
-
32
-
33
-
34
-
35
-
36
-
37
-
38
-
39
-
40
-
41
-
42
-
43
-
44
-
45
-
46
-
47
-
48
-
49
-
50
-
51
-
52
-
53
-
54
-
55
-
56
-
57
-
58
-
59
-
60
-
61
-
62
-
63
-
64
-
65
-
66
-
67
-
68
-
69
-
70
-
71
-
72
-
73
-
74
-
75
-
76
-
77
-
78
-
79
-
80
-
81
-
82
-
83
-
84
-
85
-
86
-
87
-
88
-
89
-
90
-
91
-
92
-
93
-
94
-
95
-
96
-
97
-
98
-
99
-
100
-
101
-
102
-
103
-
104
-
105
-
106
-
107
-
108
-
109
-
110
-
111
-
112
-
113
-
114
-
115
-
116
-
117
-
118
-
119
-
120
-
121
-
122
-
123
-
124
-
125
-
126
-
127
-
128
-
129
-
130
-
131
-
132
-
133
-
134
-
135
-
136
-
137
-
138
-
139
-
140
-
141
-
142
-
143
-
144
-
145
-
146
-
147
-
148
-
149
-
150
-
151
-
152
-
153
-
 154
154 -
 155
155 -
 156
156 -
 157
157 -
 158
158 -
 159
159 -
 160
160 -
 161
161 -
 162
162 -
 163
163 -
 164
164 -
 165
165 -
 166
166 -
 167
167 -
 168
168 -
 169
169 -
 170
170 -
 171
171 -
 172
172 -
 173
173 -
 174
174 -
175
-
176
-
177
-
178
-
179
-
180
-
181
-
182
-
183
-
184
-
185
-
186
-
187
-
188
-
189
-
190
-
191
-
192
-
193
-
194
-
195
-
196
-
197
-
198
-
199
-
200
-
201
-
202
-
203
-
204
-
205
-
206
-
207
-
208
-
209
-
210
-
211
-
212
-
213
-
214
-
215
-
216
-
217
-
218
-
219
-
220
-
221
-
222
-
223
-
224
-
225
-
226
-
227
-
228
-
229
-
230
-
231
-
232
-
233
-
234
-
235
-
236
-
237
-
238
-
239
-
240
-
241
-
242
-
243
-
244
-
245
-
246
-
247
-
248
-
249
-
250
-
251
-
252
-
253
-
254
-
255
 |
 |

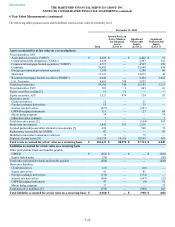
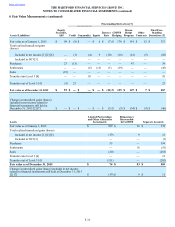
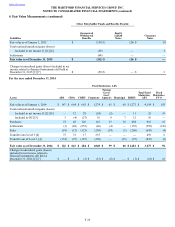
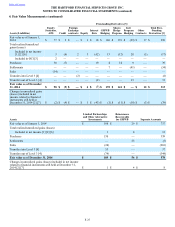
Table of Contents THE HARTFORD FINANCIAL SERVICES GROUP, INC.
NOTES TO CONSOLIDATED FINANCIAL STATEMENTS (continued)
4. Fair Value Measurements (continued)
F-33
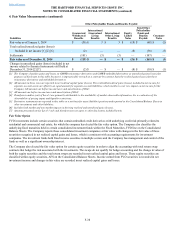
At each valuation date, the Company assumes expected returns based on:
• risk-free rates as represented by the Eurodollar futures, LIBOR deposits and swap rates to derive forward curve rates;
• market implied volatility assumptions for each underlying index based primarily on a blend of observed market implied
volatility data;
• correlations of historical returns across underlying well known market indices based on actual observed returns over the ten
years preceding the valuation date; and
• three years of history for fund indexes compared to separate account fund regression.
On a daily basis, the Company updates capital market assumptions used in the GMWB liability model such as interest rates, equity
indices and the blend of implied equity index volatilities. The Company monitors various aspects of policyholder behavior and may
modify certain of its assumptions, including living benefit lapses and withdrawal rates, if credible emerging data indicates that changes
are warranted. In addition, the Company will continue to evaluate policyholder behavior assumptions should we implement initiatives to
reduce the size of the variable annuity business. At a minimum, all policyholder behavior assumptions are reviewed and updated, as
appropriate, in conjunction with the completion of the Company’s annual comprehensive study to refine its estimate of future gross
profits.
Credit Standing Adjustment
This assumption makes an adjustment that market participants would make, in determining fair value, to reflect the risk that guaranteed
benefit obligations, or the GMWB reinsurance recoverables will not be fulfilled. The Company incorporates a blend of observable
Company and reinsurer credit default spreads from capital markets, adjusted for market recoverability. The credit standing adjustment
assumption, net of reinsurance, resulted in pre-tax realized gains (losses) of $(2), $3 and $(13), for the years ended December 31, 2015,
2014 and 2013, respectively. As of December 31, 2015 and 2014, the credit standing adjustment was $0 and $1, respectively.
Margins
The behavior risk margin adds a margin that market participants would require, in determining fair value, for the risk that the Company’s
assumptions about policyholder behavior could differ from actual experience. The behavior risk margin is calculated by taking the
difference between adverse policyholder behavior assumptions and best estimate assumptions.
Assumption updates, including policyholder behavior assumptions, affected best estimates and margins for total pre-tax realized gains
(losses) of $(42), $31 and $75 for the years ended December 31, 2015, 2014 and 2013, respectively. As of December 31, 2015 and 2014,
the behavior risk margin was $45 and $74, respectively.
In addition to the non-market-based update described in the preceding discussion, the Company recognized non-market-based updates
driven by the relative outperformance (underperformance) of the underlying actively managed funds as compared to their respective
indices resulting in pre-tax realized gains (losses) of approximately $(18), $5 and $33 for the years ended December 31, 2015, 2014 and
2013, respectively.
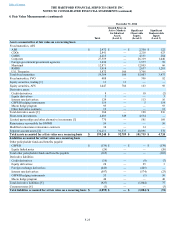
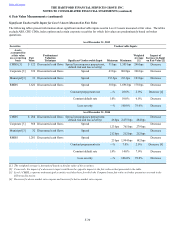
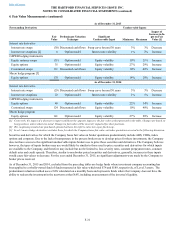
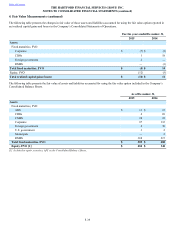
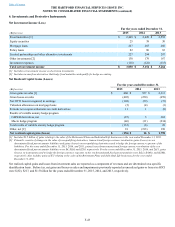
The following table provides quantitative information about the significant unobservable inputs and is applicable to all of the GMWB
embedded derivative and the GMWB reinsurance derivative for the years ended December 31, 2015 and 2014.
Significant Unobservable Input Unobservable Inputs
(Minimum) Unobservable Inputs
(Maximum) Impact of Increase in Input
on Fair Value Measurement [1]
Withdrawal Utilization [2] 20% 100% Increase
Withdrawal Rates [3] —% 8% Increase
Lapse Rates [4] —% 75% Decrease
Reset Elections [5] 20% 75% Increase
Equity Volatility [6] 10% 40% Increase
[1] Conversely, the impact of a decrease in input would have the opposite impact to the fair value as that presented in the table.
[2] Range represents assumed cumulative percentages of policyholders taking withdrawals.
[3] Range represents assumed cumulative annual amount withdrawn by policyholders.
[4] Range represents assumed annual percentages of full surrender of the underlying variable annuity contracts across all policy durations for in force
business.
[5] Range represents assumed cumulative percentages of policyholders that would elect to reset their guaranteed benefit base.
[6] Range represents implied market volatilities for equity indices based on multiple pricing sources.