The Hartford 2015 Annual Report Download - page 61
Download and view the complete annual report
Please find page 61 of the 2015 The Hartford annual report below. You can navigate through the pages in the report by either clicking on the pages listed below, or by using the keyword search tool below to find specific information within the annual report.-
 1
1 -
 2
2 -
 3
3 -
 4
4 -
 5
5 -
 6
6 -
 7
7 -
 8
8 -
 9
9 -
 10
10 -
 11
11 -
 12
12 -
 13
13 -
 14
14 -
 15
15 -
 16
16 -
 17
17 -
 18
18 -
 19
19 -
 20
20 -
 21
21 -
 22
22 -
 23
23 -
 24
24 -
 25
25 -
 26
26 -
 27
27 -
 28
28 -
 29
29 -
 30
30 -
 31
31 -
 32
32 -
 33
33 -
 34
34 -
 35
35 -
 36
36 -
 37
37 -
 38
38 -
 39
39 -
 40
40 -
 41
41 -
 42
42 -
 43
43 -
 44
44 -
 45
45 -
 46
46 -
 47
47 -
 48
48 -
 49
49 -
 50
50 -
 51
51 -
 52
52 -
 53
53 -
 54
54 -
 55
55 -
 56
56 -
 57
57 -
 58
58 -
 59
59 -
 60
60 -
 61
61 -
 62
62 -
 63
63 -
 64
64 -
 65
65 -
 66
66 -
 67
67 -
 68
68 -
 69
69 -
 70
70 -
 71
71 -
 72
72 -
 73
73 -
 74
74 -
 75
75 -
 76
76 -
 77
77 -
 78
78 -
 79
79 -
 80
80 -
 81
81 -
 82
82 -
 83
83 -
 84
84 -
 85
85 -
 86
86 -
 87
87 -
 88
88 -
 89
89 -
 90
90 -
 91
91 -
 92
92 -
 93
93 -
 94
94 -
 95
95 -
 96
96 -
 97
97 -
 98
98 -
 99
99 -
 100
100 -
 101
101 -
 102
102 -
 103
103 -
 104
104 -
 105
105 -
 106
106 -
 107
107 -
 108
108 -
 109
109 -
 110
110 -
 111
111 -
 112
112 -
 113
113 -
 114
114 -
 115
115 -
 116
116 -
 117
117 -
 118
118 -
 119
119 -
 120
120 -
 121
121 -
 122
122 -
 123
123 -
 124
124 -
 125
125 -
 126
126 -
 127
127 -
 128
128 -
 129
129 -
 130
130 -
 131
131 -
 132
132 -
 133
133 -
 134
134 -
 135
135 -
 136
136 -
 137
137 -
 138
138 -
 139
139 -
 140
140 -
 141
141 -
 142
142 -
 143
143 -
 144
144 -
 145
145 -
 146
146 -
 147
147 -
 148
148 -
 149
149 -
 150
150 -
 151
151 -
 152
152 -
 153
153 -
 154
154 -
 155
155 -
 156
156 -
 157
157 -
 158
158 -
 159
159 -
 160
160 -
 161
161 -
 162
162 -
 163
163 -
 164
164 -
 165
165 -
 166
166 -
 167
167 -
 168
168 -
 169
169 -
 170
170 -
 171
171 -
 172
172 -
 173
173 -
 174
174 -
 175
175 -
 176
176 -
 177
177 -
 178
178 -
 179
179 -
 180
180 -
 181
181 -
 182
182 -
 183
183 -
 184
184 -
 185
185 -
 186
186 -
 187
187 -
 188
188 -
 189
189 -
 190
190 -
 191
191 -
 192
192 -
 193
193 -
 194
194 -
 195
195 -
 196
196 -
 197
197 -
 198
198 -
 199
199 -
 200
200 -
 201
201 -
 202
202 -
 203
203 -
 204
204 -
 205
205 -
 206
206 -
 207
207 -
 208
208 -
 209
209 -
 210
210 -
 211
211 -
 212
212 -
 213
213 -
 214
214 -
 215
215 -
 216
216 -
 217
217 -
 218
218 -
 219
219 -
 220
220 -
 221
221 -
 222
222 -
 223
223 -
 224
224 -
 225
225 -
 226
226 -
 227
227 -
 228
228 -
 229
229 -
 230
230 -
 231
231 -
 232
232 -
 233
233 -
 234
234 -
 235
235 -
 236
236 -
 237
237 -
 238
238 -
 239
239 -
 240
240 -
 241
241 -
 242
242 -
 243
243 -
 244
244 -
 245
245 -
 246
246 -
 247
247 -
 248
248 -
 249
249 -
 250
250 -
 251
251 -
 252
252 -
 253
253 -
 254
254 -
 255
255
 |
 |

61
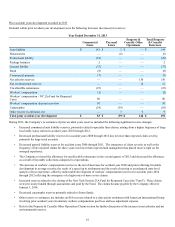
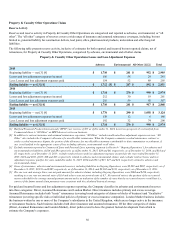
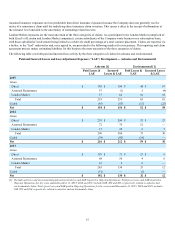
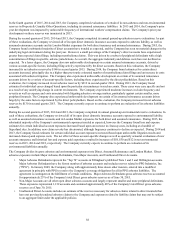
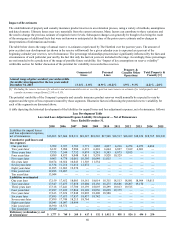
The previous table shows the cumulative deficiency (redundancy) of the Company’s reserves, net of reinsurance, as now estimated with
the benefit of additional information. Those amounts are comprised of changes in estimates of gross losses and changes in estimates of
related reinsurance recoveries.
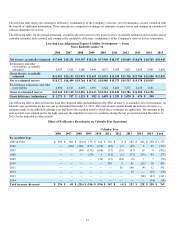
The following table, for the periods presented, reconciles the net reserves to the gross reserves, as initially estimated and recorded, and as
currently estimated and recorded, and computes the cumulative deficiency (redundancy) of the Company’s reserves before reinsurance.
Loss And Loss Adjustment Expense Liability Development — Gross
Years Ended December 31,
2006 2007 2008 2009 2010 2011 2012 2013 2014 2015
Net reserve, as initially estimated $17,604 $18,231 $18,347 $18,210 $17,948 $18,517 $18,689 $18,676 $18,765 $18,943
Reinsurance and other
recoverables, as initially
estimated 4,387 3,922 3,586 3,441 3,077 3,033 3,027 3,028 3,041 2,882
Gross reserve, as initially
estimated $21,991 $22,153 $21,933 $21,651 $21,025 $21,550 $21,716 $21,704 $21,806 $21,825
Net re-estimated reserve $18,372 $18,499 $18,764 $18,742 $18,980 $19,375 $19,515 $19,170 $19,015
Re-estimated reinsurance and other
recoverables 4,890 4,611 4,292 3,891 3,544 3,466 3,271 3,210 3,181
Gross re-estimated reserve $23,262 $23,110 $23,056 $22,633 $22,524 $22,841 $22,786 $22,380 $22,196
Gross deficiency (redundancy) $ 1,271 $ 957 $ 1,123 $ 982 $ 1,499 $ 1,291 $ 1,070 $ 676 $ 390
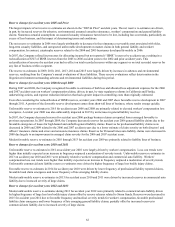
The following table is derived from the Loss Development table and summarizes the effect of reserve re-estimates, net of reinsurance, on
calendar year operations for the ten-year period ended December 31, 2015. The total of each column details the amount of reserve re-
estimates made in the indicated calendar year and shows the accident years to which the re-estimates are applicable. The amounts in the
total accident year column on the far right represent the cumulative reserve re-estimates during the ten year period ended December 31,
2015 for the indicated accident year(s).
Effect of Net Reserve Re-estimates on Calendar Year Operations
Calendar Year
2006 2007 2008 2009 2010 2011 2012 2013 2014 2015 Total
By Accident Year
2005 & Prior $ 296 $ 188 $ (29) $ 179 $ 116 $ 282 $ 4 $ 145 $ 346 $ 250 $ 1,777
2006 — (140) (148)(213)(118)(45)(7)(69) 2 25 (713)
2007 — — (49)(113)(156)(71)(15)(67) 10 9 (452)
2008 — — — (39) 1 (31)(1)(37)(13) 43 (77)
2009 — — — — (39)(13)(24)(8) 7 7 (70)
2010 — — — — — 245 3 61 (22) 16 303
2011 — — — — — — 36 148 (4) 12 192
2012 — — — — — — — 19 — (55) (36)
2013 — — — — — — — — (98)(43) (141)
2014 — — — — — — — — — (14) (14)
Total increase (decrease) $ 296 $ 48 $ (226) $ (186) $ (196) $ 367 $ (4) $ 192 $ 228 $ 250 $ 769
