The Hartford 2015 Annual Report Download - page 197
Download and view the complete annual report
Please find page 197 of the 2015 The Hartford annual report below. You can navigate through the pages in the report by either clicking on the pages listed below, or by using the keyword search tool below to find specific information within the annual report.-
 1
1 -
2
-
3
-
4
-
5
-
6
-
7
-
8
-
9
-
10
-
11
-
12
-
13
-
14
-
15
-
16
-
17
-
18
-
19
-
20
-
21
-
22
-
23
-
24
-
25
-
26
-
27
-
28
-
29
-
30
-
31
-
32
-
33
-
34
-
35
-
36
-
37
-
38
-
39
-
40
-
41
-
42
-
43
-
44
-
45
-
46
-
47
-
48
-
49
-
50
-
51
-
52
-
53
-
54
-
55
-
56
-
57
-
58
-
59
-
60
-
61
-
62
-
63
-
64
-
65
-
66
-
67
-
68
-
69
-
70
-
71
-
72
-
73
-
74
-
75
-
76
-
77
-
78
-
79
-
80
-
81
-
82
-
83
-
84
-
85
-
86
-
87
-
88
-
89
-
90
-
91
-
92
-
93
-
94
-
95
-
96
-
97
-
98
-
99
-
100
-
101
-
102
-
103
-
104
-
105
-
106
-
107
-
108
-
109
-
110
-
111
-
112
-
113
-
114
-
115
-
116
-
117
-
118
-
119
-
120
-
121
-
122
-
123
-
124
-
125
-
126
-
127
-
128
-
129
-
130
-
131
-
132
-
133
-
134
-
135
-
136
-
137
-
138
-
139
-
140
-
141
-
142
-
143
-
144
-
145
-
146
-
147
-
148
-
149
-
150
-
151
-
152
-
153
-
154
-
155
-
156
-
157
-
158
-
159
-
160
-
161
-
162
-
163
-
164
-
165
-
166
-
167
-
168
-
169
-
170
-
171
-
172
-
173
-
174
-
175
-
176
-
177
-
178
-
179
-
180
-
181
-
182
-
183
-
184
-
185
-
186
-
 187
187 -
 188
188 -
 189
189 -
 190
190 -
 191
191 -
 192
192 -
 193
193 -
 194
194 -
 195
195 -
 196
196 -
 197
197 -
 198
198 -
 199
199 -
 200
200 -
 201
201 -
 202
202 -
 203
203 -
 204
204 -
 205
205 -
 206
206 -
 207
207 -
208
-
209
-
210
-
211
-
212
-
213
-
214
-
215
-
216
-
217
-
218
-
219
-
220
-
221
-
222
-
223
-
224
-
225
-
226
-
227
-
228
-
229
-
230
-
231
-
232
-
233
-
234
-
235
-
236
-
237
-
238
-
239
-
240
-
241
-
242
-
243
-
244
-
245
-
246
-
247
-
248
-
249
-
250
-
251
-
252
-
253
-
254
-
255
 |
 |
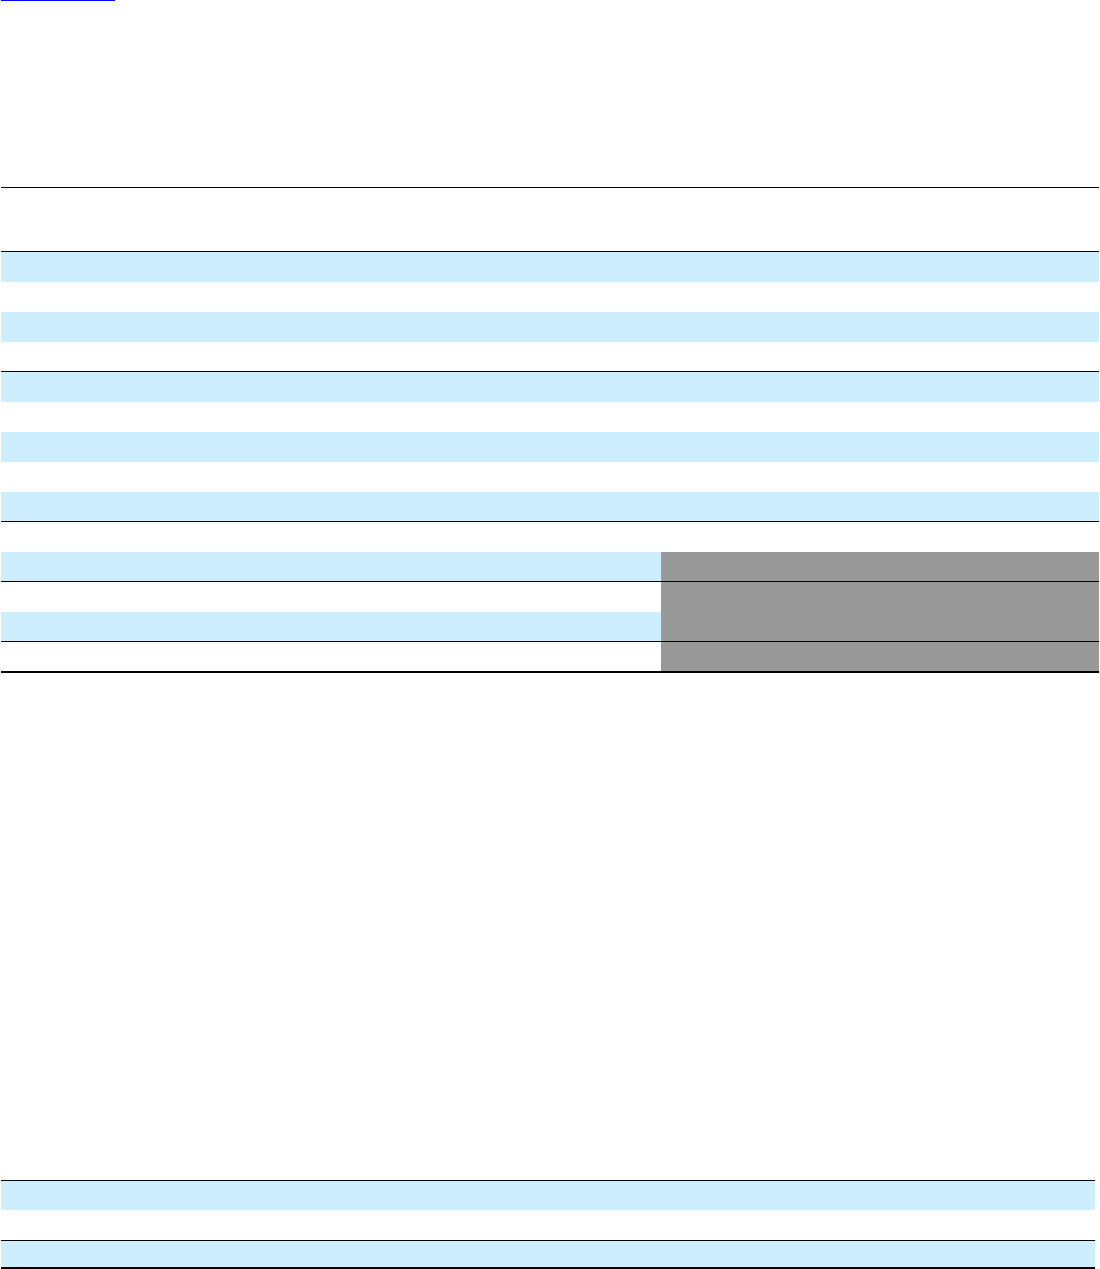
Table of Contents THE HARTFORD FINANCIAL SERVICES GROUP, INC.
NOTES TO CONSOLIDATED FINANCIAL STATEMENTS (continued)
9. Separate Accounts, Death Benefits and Other Insurance Benefit Features (continued)
F-66
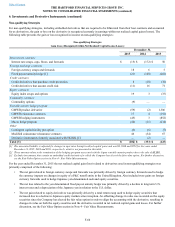
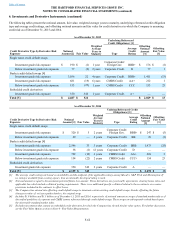
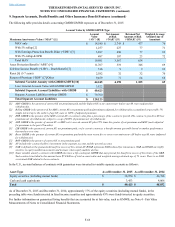
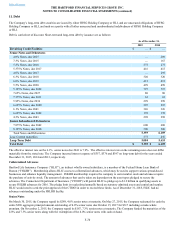
The following table provides details concerning GMDB/GMWB exposure as of December 31, 2015:
Account Value by GMDB/GMWB Type
Maximum Anniversary Value (“MAV”) [1]
Account
Value
(“AV”) [8]
Net Amount
at Risk
(“NAR”) [9]
Retained Net
Amount at Risk
(“RNAR”) [9]
Weighted Average
Attained Age of
Annuitant
MAV only $ 14,540 $ 2,743 $ 477 70
With 5% rollup [2] 1,257 227 77 71
With Earnings Protection Benefit Rider (“EPB”) [3] 3,697 490 77 69
With 5% rollup & EPB 487 107 23 72
Total MAV 19,981 3,567 654
Asset Protection Benefit (“APB”) [4] 11,707 519 346 69
Lifetime Income Benefit (“LIB”) – Death Benefit [5] 516 9 9 69
Reset [6] (5-7 years) 2,582 32 32 70
Return of Premium (“ROP”) [7]/Other 9,459 71 64 68
Subtotal Variable Annuity with GMDB/GMWB [10] 44,245 4,198 1,105 69
Less: General Account Value with GMDB/GMWB 3,822
Subtotal Separate Account Liabilities with GMDB $ 40,423
Separate Account Liabilities without GMDB $ 79,700
Total Separate Account Liabilities $ 120,123
[1] MAV GMDB is the greatest of current AV, net premiums paid and the highest AV on any anniversary before age 80 years (adjusted for
withdrawals).
[2] Rollup GMDB is the greatest of the MAV, current AV, net premium paid and premiums (adjusted for withdrawals) accumulated at generally 5%
simple interest up to the earlier of age 80 years or 100% of adjusted premiums.
[3] EPB GMDB is the greatest of the MAV, current AV, or contract value plus a percentage of the contract’s growth. The contract’s growth is AV less
premiums net of withdrawals, subject to a cap of 200% of premiums net of withdrawals.
[4] APB GMDB is the greater of current AV or MAV, not to exceed current AV plus 25% times the greater of net premiums and MAV (each adjusted
for premiums in the past 12 months).
[5] LIB GMDB is the greatest of current AV; net premiums paid; or for certain contracts, a benefit amount generally based on market performance
that ratchets over time.
[6] Reset GMDB is the greatest of current AV, net premiums paid and the most recent five to seven year anniversary AV before age 80 years (adjusted
for withdrawals).
[7] ROP GMDB is the greater of current AV or net premiums paid.
[8] AV includes the contract holder’s investment in the separate account and the general account.
[9] NAR is defined as the guaranteed benefit in excess of the current AV. RNAR represents NAR reduced for reinsurance. NAR and RNAR are highly
sensitive to equity markets movements and increase when equity markets decline.
[10] Some variable annuity contracts with GMDB also have a life-contingent GMWB that may provide for benefits in excess of the return of the GRB.
Such contracts included in this amount have $7.0 billion of total account value and weighted average attained age of 71 years. There is no NAR
or retained NAR related to these contracts.
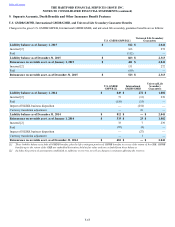
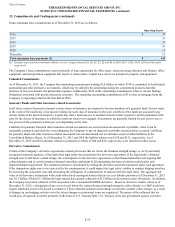
In the U.S., account balances of contracts with guarantees were invested in variable separate accounts as follows:
Asset Type As of December 31, 2015 As of December 31, 2014
Equity securities (including mutual funds) $ 36,970 $ 44,786
Cash and cash equivalents 3,453 4,066
Total $ 40,423 $ 48,852
As of December 31, 2015 and December 31, 2014, approximately 17% of the equity securities (including mutual funds), in the
preceding table were funds invested in fixed income securities and approximately 83% were funds invested in equity securities.
For further information on guaranteed living benefits that are accounted for at fair value, such as GMWB, see Note 4 - Fair Value
Measurements of Notes to Consolidated Financial Statements.