The Hartford 2015 Annual Report Download - page 113
Download and view the complete annual report
Please find page 113 of the 2015 The Hartford annual report below. You can navigate through the pages in the report by either clicking on the pages listed below, or by using the keyword search tool below to find specific information within the annual report.-
 1
1 -
2
-
3
-
4
-
5
-
6
-
7
-
8
-
9
-
10
-
11
-
12
-
13
-
14
-
15
-
16
-
17
-
18
-
19
-
20
-
21
-
22
-
23
-
24
-
25
-
26
-
27
-
28
-
29
-
30
-
31
-
32
-
33
-
34
-
35
-
36
-
37
-
38
-
39
-
40
-
41
-
42
-
43
-
44
-
45
-
46
-
47
-
48
-
49
-
50
-
51
-
52
-
53
-
54
-
55
-
56
-
57
-
58
-
59
-
60
-
61
-
62
-
63
-
64
-
65
-
66
-
67
-
68
-
69
-
70
-
71
-
72
-
73
-
74
-
75
-
76
-
77
-
78
-
79
-
80
-
81
-
82
-
83
-
84
-
85
-
86
-
87
-
88
-
89
-
90
-
91
-
92
-
93
-
94
-
95
-
96
-
97
-
98
-
99
-
100
-
101
-
102
-
 103
103 -
 104
104 -
 105
105 -
 106
106 -
 107
107 -
 108
108 -
 109
109 -
 110
110 -
 111
111 -
 112
112 -
 113
113 -
 114
114 -
 115
115 -
 116
116 -
 117
117 -
 118
118 -
 119
119 -
 120
120 -
 121
121 -
 122
122 -
 123
123 -
124
-
125
-
126
-
127
-
128
-
129
-
130
-
131
-
132
-
133
-
134
-
135
-
136
-
137
-
138
-
139
-
140
-
141
-
142
-
143
-
144
-
145
-
146
-
147
-
148
-
149
-
150
-
151
-
152
-
153
-
154
-
155
-
156
-
157
-
158
-
159
-
160
-
161
-
162
-
163
-
164
-
165
-
166
-
167
-
168
-
169
-
170
-
171
-
172
-
173
-
174
-
175
-
176
-
177
-
178
-
179
-
180
-
181
-
182
-
183
-
184
-
185
-
186
-
187
-
188
-
189
-
190
-
191
-
192
-
193
-
194
-
195
-
196
-
197
-
198
-
199
-
200
-
201
-
202
-
203
-
204
-
205
-
206
-
207
-
208
-
209
-
210
-
211
-
212
-
213
-
214
-
215
-
216
-
217
-
218
-
219
-
220
-
221
-
222
-
223
-
224
-
225
-
226
-
227
-
228
-
229
-
230
-
231
-
232
-
233
-
234
-
235
-
236
-
237
-
238
-
239
-
240
-
241
-
242
-
243
-
244
-
245
-
246
-
247
-
248
-
249
-
250
-
251
-
252
-
253
-
254
-
255
 |
 |

113
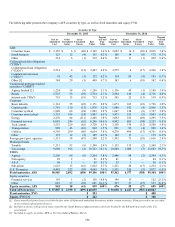
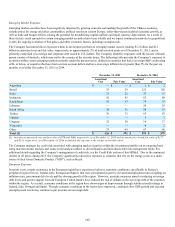
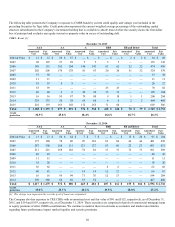
Municipal Bonds
The following table summarizes the amortized cost, fair value, and weighted average credit quality of the Company's available-for-sale
investments in municipal bonds.
December 31, 2015 December 31, 2014
Amortized
Cost Fair Value
Weighted
Average
Credit Quality Amortized
Cost Fair Value
Weighted
Average
Credit Quality
General Obligation $ 2,069 $ 2,243 AA $ 2,259 $ 2,480 AA
Pre-Refunded [1] 850 903 AAA 716 748 AAA
Revenue
Transportation 1,566 1,744 A+ 1,599 1,781 A+
Health Care 1,371 1,499 AA- 1,412 1,560 AA-
Water & Sewer 1,228 1,324 AA 1,204 1,308 AA
Education 1,109 1,205 AA 1,115 1,232 AA
Sales Tax 692 779 AA- 916 1,020 AA-
Leasing [2] 728 803 AA- 772 858 AA-
Power 658 709 A+ 739 814 A+
Housing 91 94 AA 148 153 AA
Other 762 818 AA- 855 917 AA-
Total Revenue 8,205 8,975 AA- 8,760 9,643 AA-
Total Municipal $ 11,124 $ 12,121 AA- $ 11,735 $ 12,871 AA-
[1] Pre-Refunded bonds are bonds for which an irrevocable trust containing sufficient U.S. treasury, agency, or other securities has been established
to fund the remaining payments of principal and interest.
[2] Leasing revenue bonds are generally the obligations of a financing authority established by the municipality that leases facilities back to a
municipality. The notes are typically secured by lease payments made by the municipality that is leasing the facilities financed by the issue. Lease
payments may be subject to annual appropriation by the municipality or the municipality may be obligated to appropriate general tax revenues to
make lease payments.
As of December 31, 2015, the largest issuer concentrations were the state of California, the Commonwealth of Massachusetts, and the
New York Dormitory Authority, which each comprised less than 3% of the municipal bond portfolio and were comprised of general
obligation and revenue bonds. As of December 31, 2014, the largest issuer concentrations were the states of Illinois and California, as
well as the Commonwealth of Massachusetts, which each comprised less than 3% of the municipal bond portfolio, and were primarily
comprised of general obligation and taxable bonds.
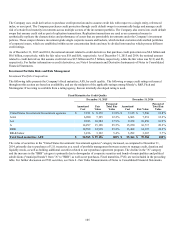
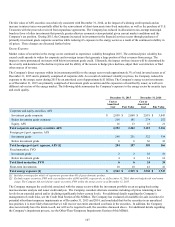
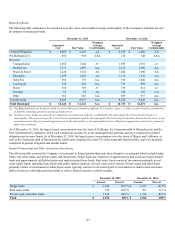
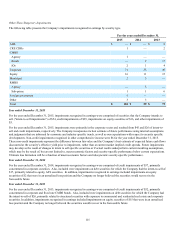
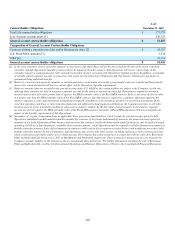
Limited Partnerships and Other Alternative Investments
The following table presents the Company’s investments in limited partnerships and other alternative investments which include hedge
funds, real estate funds, and private equity and other funds. Hedge funds are comprised of approximately half credit and equity-related
funds and approximately half global macro and market neutral focus funds. Real estate funds consist of investments primarily in real
estate equity funds, including some funds with public market exposure, and real estate joint ventures. Private equity and other funds
primarily consist of investments in funds whose assets typically consist of a diversified pool of investments in small to mid-sized non-
public businesses with high growth potential as well as limited exposure to public markets.
December 31, 2015 December 31, 2014
Amount Percent Amount Percent
Hedge funds $ 1,034 36.0 % $ 1,187 40.3 %
Real estate funds 576 20.0 % 561 19.1 %
Private equity and other funds 1,264 44.0 % 1,194 40.6 %
Total $ 2,874 100% $ 2,942 100%