The Hartford 2015 Annual Report Download - page 169
Download and view the complete annual report
Please find page 169 of the 2015 The Hartford annual report below. You can navigate through the pages in the report by either clicking on the pages listed below, or by using the keyword search tool below to find specific information within the annual report.-
 1
1 -
2
-
3
-
4
-
5
-
6
-
7
-
8
-
9
-
10
-
11
-
12
-
13
-
14
-
15
-
16
-
17
-
18
-
19
-
20
-
21
-
22
-
23
-
24
-
25
-
26
-
27
-
28
-
29
-
30
-
31
-
32
-
33
-
34
-
35
-
36
-
37
-
38
-
39
-
40
-
41
-
42
-
43
-
44
-
45
-
46
-
47
-
48
-
49
-
50
-
51
-
52
-
53
-
54
-
55
-
56
-
57
-
58
-
59
-
60
-
61
-
62
-
63
-
64
-
65
-
66
-
67
-
68
-
69
-
70
-
71
-
72
-
73
-
74
-
75
-
76
-
77
-
78
-
79
-
80
-
81
-
82
-
83
-
84
-
85
-
86
-
87
-
88
-
89
-
90
-
91
-
92
-
93
-
94
-
95
-
96
-
97
-
98
-
99
-
100
-
101
-
102
-
103
-
104
-
105
-
106
-
107
-
108
-
109
-
110
-
111
-
112
-
113
-
114
-
115
-
116
-
117
-
118
-
119
-
120
-
121
-
122
-
123
-
124
-
125
-
126
-
127
-
128
-
129
-
130
-
131
-
132
-
133
-
134
-
135
-
136
-
137
-
138
-
139
-
140
-
141
-
142
-
143
-
144
-
145
-
146
-
147
-
148
-
149
-
150
-
151
-
152
-
153
-
154
-
155
-
156
-
157
-
158
-
 159
159 -
 160
160 -
 161
161 -
 162
162 -
 163
163 -
 164
164 -
 165
165 -
 166
166 -
 167
167 -
 168
168 -
 169
169 -
 170
170 -
 171
171 -
 172
172 -
 173
173 -
 174
174 -
 175
175 -
 176
176 -
 177
177 -
 178
178 -
 179
179 -
180
-
181
-
182
-
183
-
184
-
185
-
186
-
187
-
188
-
189
-
190
-
191
-
192
-
193
-
194
-
195
-
196
-
197
-
198
-
199
-
200
-
201
-
202
-
203
-
204
-
205
-
206
-
207
-
208
-
209
-
210
-
211
-
212
-
213
-
214
-
215
-
216
-
217
-
218
-
219
-
220
-
221
-
222
-
223
-
224
-
225
-
226
-
227
-
228
-
229
-
230
-
231
-
232
-
233
-
234
-
235
-
236
-
237
-
238
-
239
-
240
-
241
-
242
-
243
-
244
-
245
-
246
-
247
-
248
-
249
-
250
-
251
-
252
-
253
-
254
-
255
 |
 |
Table of Contents THE HARTFORD FINANCIAL SERVICES GROUP, INC.
NOTES TO CONSOLIDATED FINANCIAL STATEMENTS (continued)
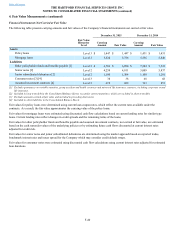
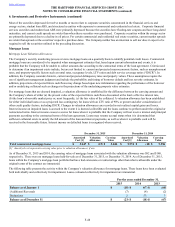
4. Fair Value Measurements (continued)
F-38
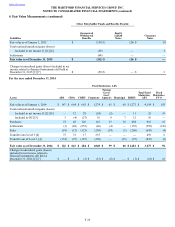
Other Policyholder Funds and Benefits Payable
Liabilities
Guaranteed
Withdrawal
Benefits
International
Guaranteed
Living
Benefits
International
Other Living
Benefits
Equity
Linked
Notes
Total Other
Policyholder
Funds and
Benefits
Payable Consumer
Notes
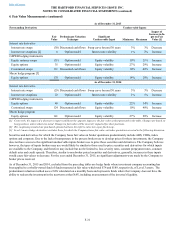
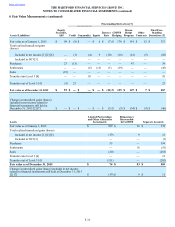
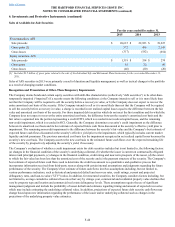
Fair value as of January 1, 2014 $ (36) $ 3 $ 3 $ (18) $ (48) $ (2)
Total realized/unrealized gains (losses)
Included in net income [1] [2] [6] (2) — — (8)(10) (1)
Settlements (101)(3)(3) — (107) —
Fair value as of December 31, 2014 $ (139) $ — $ — $ (26) $ (165) $ (3)
Changes in unrealized gains (losses) included in net
income related to financial instruments still held at
December 31, 2014 [2] [7] $ (2) $ — $ — $ (8) $ (10) $ (1)
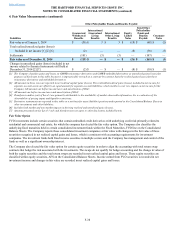
[1] The Company classifies gains and losses on GMWB reinsurance derivatives and GMWB embedded derivatives as unrealized gains (losses) for
purposes of disclosure in this table because it is impracticable to track on a contract-by-contract basis the realized gains (losses) for these
reinsurance derivatives and embedded derivatives.
[2] All amounts in these rows are reported in net realized capital gains (losses). The realized/unrealized gains (losses) included in net income for
separate account assets are offset by an equal amount for separate account liabilities, which results in a net zero impact on net income for the
Company. All amounts are before income taxes and amortization of DAC.
[3] All amounts are before income taxes and amortization of DAC.
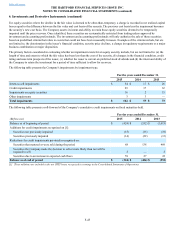
[4] Transfers in and/or (out) of Level 3 are primarily attributable to the availability of market observable information, the re-evaluation of the
observability of pricing inputs and liquidity restrictions.
[5] Derivative instruments are reported in this table on a net basis for asset (liability) positions and reported in the Consolidated Balance Sheets in
other investments and other liabilities.
[6] Includes both market and non-market impacts in deriving realized and unrealized gains (losses).
[7] Amounts presented are for Level 3 only and therefore may not agree to other disclosures included herein.
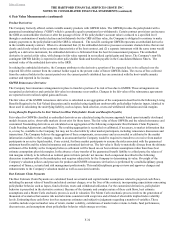
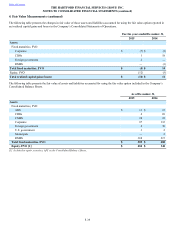
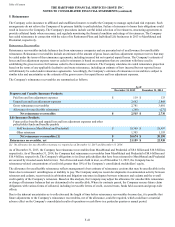
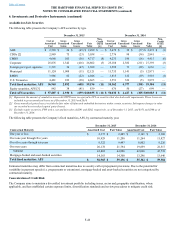
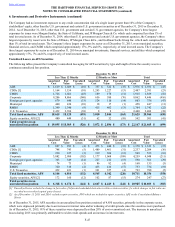
Fair Value Option
FVO investments include certain securities that contain embedded credit derivatives with underlying credit risk primarily related to
residential and commercial real estate, for which the company has elected the fair value option. The Company also classifies the
underlying fixed maturities held in certain consolidated investment funds within the Fixed Maturities, FVO line on the Consolidated
Balance Sheets. The Company reports these consolidated investment companies at fair value with changes in the fair value of these
securities recognized in net realized capital gains and losses, which is consistent with accounting requirements for investment
companies. The investment funds hold fixed income securities in multiple sectors and the Company has management and control of the
funds as well as a significant ownership interest.
The Company also elected the fair value option for certain equity securities in order to align the accounting with total return swap
contracts that hedge the risk associated with the investments. The swaps do not qualify for hedge accounting and the change in value of
both the equity securities and the total return swaps are recorded in net realized capital gains and losses. These equity securities are
classified within equity securities, AFS on the Consolidated Balance Sheets. Income earned from FVO securities is recorded in net
investment income and changes in fair value are recorded in net realized capital gains and losses.