The Hartford 2015 Annual Report Download - page 136
Download and view the complete annual report
Please find page 136 of the 2015 The Hartford annual report below. You can navigate through the pages in the report by either clicking on the pages listed below, or by using the keyword search tool below to find specific information within the annual report.-
 1
1 -
2
-
3
-
4
-
5
-
6
-
7
-
8
-
9
-
10
-
11
-
12
-
13
-
14
-
15
-
16
-
17
-
18
-
19
-
20
-
21
-
22
-
23
-
24
-
25
-
26
-
27
-
28
-
29
-
30
-
31
-
32
-
33
-
34
-
35
-
36
-
37
-
38
-
39
-
40
-
41
-
42
-
43
-
44
-
45
-
46
-
47
-
48
-
49
-
50
-
51
-
52
-
53
-
54
-
55
-
56
-
57
-
58
-
59
-
60
-
61
-
62
-
63
-
64
-
65
-
66
-
67
-
68
-
69
-
70
-
71
-
72
-
73
-
74
-
75
-
76
-
77
-
78
-
79
-
80
-
81
-
82
-
83
-
84
-
85
-
86
-
87
-
88
-
89
-
90
-
91
-
92
-
93
-
94
-
95
-
96
-
97
-
98
-
99
-
100
-
101
-
102
-
103
-
104
-
105
-
106
-
107
-
108
-
109
-
110
-
111
-
112
-
113
-
114
-
115
-
116
-
117
-
118
-
119
-
120
-
121
-
122
-
123
-
124
-
125
-
 126
126 -
 127
127 -
 128
128 -
 129
129 -
 130
130 -
 131
131 -
 132
132 -
 133
133 -
 134
134 -
 135
135 -
 136
136 -
 137
137 -
 138
138 -
 139
139 -
 140
140 -
 141
141 -
 142
142 -
 143
143 -
 144
144 -
 145
145 -
 146
146 -
147
-
148
-
149
-
150
-
151
-
152
-
153
-
154
-
155
-
156
-
157
-
158
-
159
-
160
-
161
-
162
-
163
-
164
-
165
-
166
-
167
-
168
-
169
-
170
-
171
-
172
-
173
-
174
-
175
-
176
-
177
-
178
-
179
-
180
-
181
-
182
-
183
-
184
-
185
-
186
-
187
-
188
-
189
-
190
-
191
-
192
-
193
-
194
-
195
-
196
-
197
-
198
-
199
-
200
-
201
-
202
-
203
-
204
-
205
-
206
-
207
-
208
-
209
-
210
-
211
-
212
-
213
-
214
-
215
-
216
-
217
-
218
-
219
-
220
-
221
-
222
-
223
-
224
-
225
-
226
-
227
-
228
-
229
-
230
-
231
-
232
-
233
-
234
-
235
-
236
-
237
-
238
-
239
-
240
-
241
-
242
-
243
-
244
-
245
-
246
-
247
-
248
-
249
-
250
-
251
-
252
-
253
-
254
-
255
 |
 |
Table of Contents
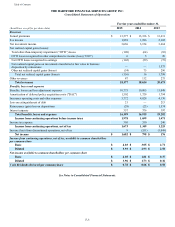
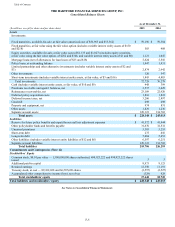
THE HARTFORD FINANCIAL SERVICES GROUP, INC.
Consolidated Balance Sheets
F-5
As of December 31,
(In millions, except for share and per share data) 2015 2014
Assets
Investments:
Fixed maturities, available-for-sale, at fair value (amortized cost of $56,965 and $55,362) $ 59,196 $ 59,384
Fixed maturities, at fair value using the fair value option (includes variable interest entity assets of $150
and $218) 503 488
Equity securities, available-for-sale, at fair value (cost of $1,135 and $1,027) (includes equity securities,
at fair value using the fair value option, of $282 and $348, and variable interest entity assets of $1 and $0) 1,121 1,047
Mortgage loans (net of allowances for loan losses of $23 and $18) 5,624 5,556
Policy loans, at outstanding balance 1,447 1,431
Limited partnerships and other alternative investments (includes variable interest entity assets of $2 and
$3) 2,874 2,942
Other investments 120 547
Short-term investments (includes variable interest entity assets, at fair value, of $3 and $16) 1,843 4,883
Total investments 72,728 76,278
Cash (includes variable interest entity assets, at fair value, of $10 and $9) 448 399
Premiums receivable and agents’ balances, net 3,537 3,429
Reinsurance recoverables, net 23,189 22,920
Deferred policy acquisition costs 1,816 1,823
Deferred income taxes, net 3,206 2,897
Goodwill 498 498
Property and equipment, net 974 831
Other assets 1,829 1,236
Separate account assets 120,123 134,702
Total assets $ 228,348 $ 245,013
Liabilities
Reserve for future policy benefits and unpaid losses and loss adjustment expenses $ 41,572 $ 41,444
Other policyholder funds and benefits payable 31,670 32,532
Unearned premiums 5,385 5,255
Short-term debt 275 456
Long-term debt 5,084 5,653
Other liabilities (includes variable interest entity liabilities of $12 and $6) 6,597 6,251
Separate account liabilities 120,123 134,702
Total liabilities 210,706 226,293
Commitments and Contingencies (Note 12)
Stockholders’ Equity
Common stock, $0.01 par value — 1,500,000,000 shares authorized, 490,923,222 and 490,923,222 shares
issued 5 5
Additional paid-in capital 8,973 9,123
Retained earnings 12,550 11,191
Treasury stock, at cost — 89,102,038 and 66,507,690 shares (3,557) (2,527)
Accumulated other comprehensive income (loss), net of tax (329) 928
Total stockholders' equity 17,642 18,720
Total liabilities and stockholders’ equity $ 228,348 $ 245,013
See Notes to Consolidated Financial Statements.