The Hartford 2015 Annual Report Download - page 230
Download and view the complete annual report
Please find page 230 of the 2015 The Hartford annual report below. You can navigate through the pages in the report by either clicking on the pages listed below, or by using the keyword search tool below to find specific information within the annual report.-
 1
1 -
2
-
3
-
4
-
5
-
6
-
7
-
8
-
9
-
10
-
11
-
12
-
13
-
14
-
15
-
16
-
17
-
18
-
19
-
20
-
21
-
22
-
23
-
24
-
25
-
26
-
27
-
28
-
29
-
30
-
31
-
32
-
33
-
34
-
35
-
36
-
37
-
38
-
39
-
40
-
41
-
42
-
43
-
44
-
45
-
46
-
47
-
48
-
49
-
50
-
51
-
52
-
53
-
54
-
55
-
56
-
57
-
58
-
59
-
60
-
61
-
62
-
63
-
64
-
65
-
66
-
67
-
68
-
69
-
70
-
71
-
72
-
73
-
74
-
75
-
76
-
77
-
78
-
79
-
80
-
81
-
82
-
83
-
84
-
85
-
86
-
87
-
88
-
89
-
90
-
91
-
92
-
93
-
94
-
95
-
96
-
97
-
98
-
99
-
100
-
101
-
102
-
103
-
104
-
105
-
106
-
107
-
108
-
109
-
110
-
111
-
112
-
113
-
114
-
115
-
116
-
117
-
118
-
119
-
120
-
121
-
122
-
123
-
124
-
125
-
126
-
127
-
128
-
129
-
130
-
131
-
132
-
133
-
134
-
135
-
136
-
137
-
138
-
139
-
140
-
141
-
142
-
143
-
144
-
145
-
146
-
147
-
148
-
149
-
150
-
151
-
152
-
153
-
154
-
155
-
156
-
157
-
158
-
159
-
160
-
161
-
162
-
163
-
164
-
165
-
166
-
167
-
168
-
169
-
170
-
171
-
172
-
173
-
174
-
175
-
176
-
177
-
178
-
179
-
180
-
181
-
182
-
183
-
184
-
185
-
186
-
187
-
188
-
189
-
190
-
191
-
192
-
193
-
194
-
195
-
196
-
197
-
198
-
199
-
200
-
201
-
202
-
203
-
204
-
205
-
206
-
207
-
208
-
209
-
210
-
211
-
212
-
213
-
214
-
215
-
216
-
217
-
218
-
219
-
 220
220 -
 221
221 -
 222
222 -
 223
223 -
 224
224 -
 225
225 -
 226
226 -
 227
227 -
 228
228 -
 229
229 -
 230
230 -
 231
231 -
 232
232 -
 233
233 -
 234
234 -
 235
235 -
 236
236 -
 237
237 -
 238
238 -
 239
239 -
 240
240 -
241
-
242
-
243
-
244
-
245
-
246
-
247
-
248
-
249
-
250
-
251
-
252
-
253
-
254
-
255
 |
 |

Table of Contents THE HARTFORD FINANCIAL SERVICES GROUP, INC.
NOTES TO CONSOLIDATED FINANCIAL STATEMENTS (continued)
18. Discontinued Operations and Business Dispositions (continued)
F-99
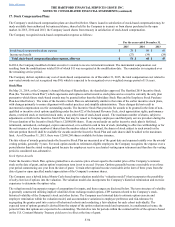
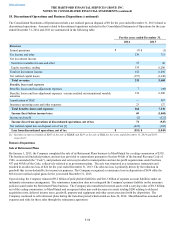
Sale of Individual Life
On January 2, 2013, the Company completed the sale of its Individual Life insurance business to Prudential for consideration of $615
consisting primarily of a ceding commission. The business sold included variable universal life, universal life, and term life insurance.
The sale was structured as a reinsurance transaction and resulted in a loss on business disposition consisting of a reinsurance loss
partially offset by realized capital gains. The Company recognized a reinsurance loss on business disposition of $533, pre-tax, which
included a goodwill impairment charge of $342 and a loss accrual for premium deficiency of $191, for the year ended December 31,
2012.
Upon closing the Company recognized an additional $940 in reinsurance loss on disposition offset by $940 in realized capital gains for a
$0 impact on income, pre-tax, for the year ended December 31, 2013. In addition, the Company reinsured $8.7 billion of policyholder
liabilities and $5.3 billion of separate account liabilities under indemnity reinsurance arrangements. The reinsurance transaction does
not extinguish the Company's primary liability on the insurance policies issued under the Individual Life business. The Company also
transferred invested assets with a carrying value of $8.0 billion, exclusive of $1.4 billion of assets supporting the modified coinsurance
agreement, net of cash transferred in place of short-term investments, to Prudential and recognized other non-cash decreases in assets
totaling $1.8 billion relating to deferred acquisition costs, deferred income taxes, property and equipment and other assets and other non-
cash decreases in liabilities totaling $1.5 billion relating to other liabilities including the $191 loss accrual for premium deficiency,
associated with the disposition. The Company continued to sell life insurance products and riders during the transition period which
ended on June 30, 2014. Prudential has assumed all expenses and risk for these sales through the reinsurance agreement.
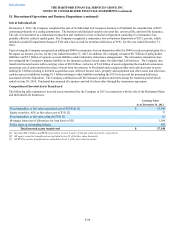
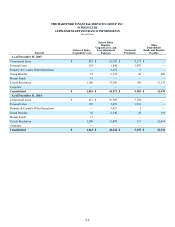
Composition of Invested Assets Transferred
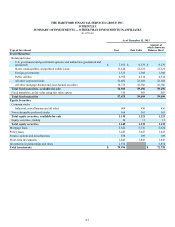
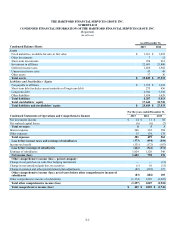
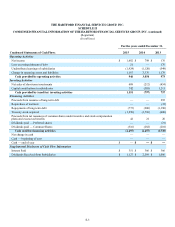
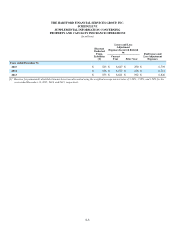
The following table summarizes invested assets transferred by the Company in 2013 in connection with the sale of the Retirement Plans
and Individual Life businesses.
Carrying Value
As of December 31, 2012
Fixed maturities, at fair value (amortized cost of $13,916) [1] $ 15,349
Equity securities, AFS, at fair value (cost of $35) [2] 37
Fixed maturities, at fair value using the FVO [3] 16
Mortgage loans (net of allowances for loan losses of $1) 1,364
Policy loans, at outstanding balance 582
Total invested assets transferred $ 17,348
[1] Includes $14.7 billion and $670 of securities in level 2 and 3 of the fair value hierarchy, respectively.
[2] All equity securities transferred are included in level 2 of the fair value hierarchy.
[3] All FVO securities transferred are included in level 3 of the fair value hierarchy.