The Hartford 2015 Annual Report Download - page 158
Download and view the complete annual report
Please find page 158 of the 2015 The Hartford annual report below. You can navigate through the pages in the report by either clicking on the pages listed below, or by using the keyword search tool below to find specific information within the annual report.-
 1
1 -
2
-
3
-
4
-
5
-
6
-
7
-
8
-
9
-
10
-
11
-
12
-
13
-
14
-
15
-
16
-
17
-
18
-
19
-
20
-
21
-
22
-
23
-
24
-
25
-
26
-
27
-
28
-
29
-
30
-
31
-
32
-
33
-
34
-
35
-
36
-
37
-
38
-
39
-
40
-
41
-
42
-
43
-
44
-
45
-
46
-
47
-
48
-
49
-
50
-
51
-
52
-
53
-
54
-
55
-
56
-
57
-
58
-
59
-
60
-
61
-
62
-
63
-
64
-
65
-
66
-
67
-
68
-
69
-
70
-
71
-
72
-
73
-
74
-
75
-
76
-
77
-
78
-
79
-
80
-
81
-
82
-
83
-
84
-
85
-
86
-
87
-
88
-
89
-
90
-
91
-
92
-
93
-
94
-
95
-
96
-
97
-
98
-
99
-
100
-
101
-
102
-
103
-
104
-
105
-
106
-
107
-
108
-
109
-
110
-
111
-
112
-
113
-
114
-
115
-
116
-
117
-
118
-
119
-
120
-
121
-
122
-
123
-
124
-
125
-
126
-
127
-
128
-
129
-
130
-
131
-
132
-
133
-
134
-
135
-
136
-
137
-
138
-
139
-
140
-
141
-
142
-
143
-
144
-
145
-
146
-
147
-
 148
148 -
 149
149 -
 150
150 -
 151
151 -
 152
152 -
 153
153 -
 154
154 -
 155
155 -
 156
156 -
 157
157 -
 158
158 -
 159
159 -
 160
160 -
 161
161 -
 162
162 -
 163
163 -
 164
164 -
 165
165 -
 166
166 -
 167
167 -
 168
168 -
169
-
170
-
171
-
172
-
173
-
174
-
175
-
176
-
177
-
178
-
179
-
180
-
181
-
182
-
183
-
184
-
185
-
186
-
187
-
188
-
189
-
190
-
191
-
192
-
193
-
194
-
195
-
196
-
197
-
198
-
199
-
200
-
201
-
202
-
203
-
204
-
205
-
206
-
207
-
208
-
209
-
210
-
211
-
212
-
213
-
214
-
215
-
216
-
217
-
218
-
219
-
220
-
221
-
222
-
223
-
224
-
225
-
226
-
227
-
228
-
229
-
230
-
231
-
232
-
233
-
234
-
235
-
236
-
237
-
238
-
239
-
240
-
241
-
242
-
243
-
244
-
245
-
246
-
247
-
248
-
249
-
250
-
251
-
252
-
253
-
254
-
255
 |
 |

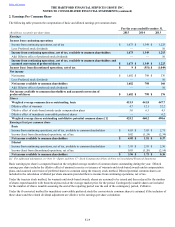
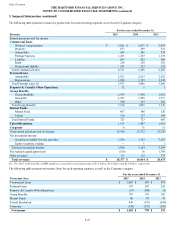
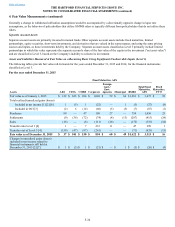
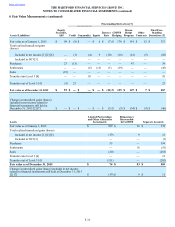
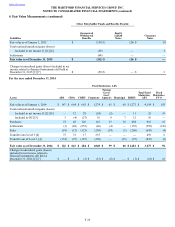
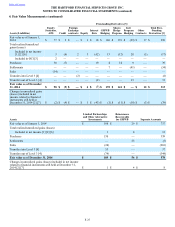
Table of Contents THE HARTFORD FINANCIAL SERVICES GROUP, INC.
NOTES TO CONSOLIDATED FINANCIAL STATEMENTS (continued)
4. Fair Value Measurements (continued)
F-27
The Securities Working Group performs ongoing analyses of the prices and credit spreads received from third parties to ensure that the
prices represent a reasonable estimate of the fair value. This process involves quantitative and qualitative analysis and is overseen by
investment and accounting professionals. As a part of these analyses, the Company considers trading volume, new issuance activity and
other factors to determine whether the market activity is significantly different than normal activity in an active market, and if so,
whether transactions may not be orderly considering the weight of available evidence. If the available evidence indicates that pricing is
based upon transactions that are stale or not orderly, the Company places little, if any, weight on the transaction price and will estimate
fair value utilizing an internal pricing model. In addition, the Company ensures that prices received from independent brokers represent a
reasonable estimate of fair value through the use of internal and external cash flow models utilizing spreads, and when available, market
indices. As a result of this analysis, if the Company determines that there is a more appropriate fair value based upon the available
market data, the price received from the third party is adjusted accordingly and approved by the Valuation Committee.
The Company conducts other specific monitoring controls around pricing. Daily analyses identify price changes over 3% for fixed
maturities and 5% for equity securities and trade prices for both debt and equity securities that differ over 3% to the current day's price.
Weekly analyses identify prices that differ more than 5% from published bond prices of a corporate bond index. Monthly analyses
identify price changes over 3%, prices that have not changed, and missing prices. Also on a monthly basis, a second source validation is
performed on most sectors. Analyses are conducted by a dedicated pricing unit that follows up with trading and investment sector
professionals and challenges prices with vendors when the estimated assumptions used differ from what the Company feels a market
participant would use. Examples of other procedures performed include, but are not limited to, initial and on-going review of third-party
pricing services’ methodologies, review of pricing statistics and trends, and back testing recent trades.
The Company has analyzed the third-party pricing services’ valuation methodologies and related inputs, and has also evaluated the
various types of securities in its investment portfolio to determine an appropriate fair value hierarchy level based upon trading activity
and the observability of market inputs. Most prices provided by third-party pricing services are classified into Level 2 because the inputs
used in pricing the securities are observable. Due to the lack of transparency in the process that brokers use to develop prices, most
valuations that are based on brokers’ prices are classified as Level 3. Some valuations may be classified as Level 2 if the price can be
corroborated with observable market data.
Derivative Instruments, including Embedded Derivatives within Investments
Derivative instruments are fair valued using pricing valuation models for OTC derivatives that utilize independent market data inputs,
quoted market prices for exchange-traded and OTC-cleared derivatives, or independent broker quotations. Excluding embedded and
reinsurance related derivatives, as of December 31, 2015 and 2014, 96% and 96%, respectively, of derivatives, based upon notional
values, were priced by valuation models, including discounted cash flow models and option-pricing models that utilize present value
techniques, or quoted market prices. The remaining derivatives were priced by broker quotations.
The Derivatives Working Group performs ongoing analyses of the valuations, assumptions and methodologies used to ensure that the
prices represent a reasonable estimate of the fair value. The Company performs various controls on derivative valuations which include
both quantitative and qualitative analyses. Analyses are conducted by a dedicated derivative pricing team that works directly with
investment sector professionals to analyze impacts of changes in the market environment and investigate variances. On a daily basis,
market valuations are compared to counterparty valuations for OTC derivatives. There are monthly analyses to identify market value
changes greater than pre-defined thresholds, stale prices, missing prices, and zero prices. Also on a monthly basis, a second source
validation, typically to broker quotations, is performed for certain of the more complex derivatives and all new deals during the month. A
model validation review is performed on any new models, which typically includes detailed documentation and validation to a second
source. The model validation documentation and results of validation are presented to the Valuation Committee for approval. There is a
monthly control to review changes in pricing sources to ensure that new models are not moved to production until formally approved.
The Company utilizes derivative instruments to manage the risk associated with certain assets and liabilities. However, the derivative
instrument may not be classified with the same fair value hierarchy level as the associated assets and liabilities. Therefore, the realized
and unrealized gains and losses on derivatives reported in the Level 3 rollforward may be offset by realized and unrealized gains and
losses of the associated assets and liabilities in other line items of the financial statements.