The Hartford 2015 Annual Report Download - page 162
Download and view the complete annual report
Please find page 162 of the 2015 The Hartford annual report below. You can navigate through the pages in the report by either clicking on the pages listed below, or by using the keyword search tool below to find specific information within the annual report.-
 1
1 -
2
-
3
-
4
-
5
-
6
-
7
-
8
-
9
-
10
-
11
-
12
-
13
-
14
-
15
-
16
-
17
-
18
-
19
-
20
-
21
-
22
-
23
-
24
-
25
-
26
-
27
-
28
-
29
-
30
-
31
-
32
-
33
-
34
-
35
-
36
-
37
-
38
-
39
-
40
-
41
-
42
-
43
-
44
-
45
-
46
-
47
-
48
-
49
-
50
-
51
-
52
-
53
-
54
-
55
-
56
-
57
-
58
-
59
-
60
-
61
-
62
-
63
-
64
-
65
-
66
-
67
-
68
-
69
-
70
-
71
-
72
-
73
-
74
-
75
-
76
-
77
-
78
-
79
-
80
-
81
-
82
-
83
-
84
-
85
-
86
-
87
-
88
-
89
-
90
-
91
-
92
-
93
-
94
-
95
-
96
-
97
-
98
-
99
-
100
-
101
-
102
-
103
-
104
-
105
-
106
-
107
-
108
-
109
-
110
-
111
-
112
-
113
-
114
-
115
-
116
-
117
-
118
-
119
-
120
-
121
-
122
-
123
-
124
-
125
-
126
-
127
-
128
-
129
-
130
-
131
-
132
-
133
-
134
-
135
-
136
-
137
-
138
-
139
-
140
-
141
-
142
-
143
-
144
-
145
-
146
-
147
-
148
-
149
-
150
-
151
-
 152
152 -
 153
153 -
 154
154 -
 155
155 -
 156
156 -
 157
157 -
 158
158 -
 159
159 -
 160
160 -
 161
161 -
 162
162 -
 163
163 -
 164
164 -
 165
165 -
 166
166 -
 167
167 -
 168
168 -
 169
169 -
 170
170 -
 171
171 -
 172
172 -
173
-
174
-
175
-
176
-
177
-
178
-
179
-
180
-
181
-
182
-
183
-
184
-
185
-
186
-
187
-
188
-
189
-
190
-
191
-
192
-
193
-
194
-
195
-
196
-
197
-
198
-
199
-
200
-
201
-
202
-
203
-
204
-
205
-
206
-
207
-
208
-
209
-
210
-
211
-
212
-
213
-
214
-
215
-
216
-
217
-
218
-
219
-
220
-
221
-
222
-
223
-
224
-
225
-
226
-
227
-
228
-
229
-
230
-
231
-
232
-
233
-
234
-
235
-
236
-
237
-
238
-
239
-
240
-
241
-
242
-
243
-
244
-
245
-
246
-
247
-
248
-
249
-
250
-
251
-
252
-
253
-
254
-
255
 |
 |
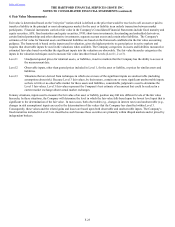
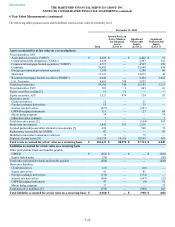
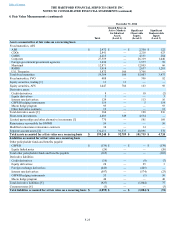
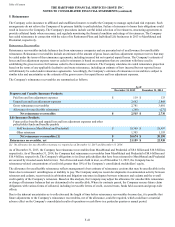
Table of Contents THE HARTFORD FINANCIAL SERVICES GROUP, INC.
NOTES TO CONSOLIDATED FINANCIAL STATEMENTS (continued)
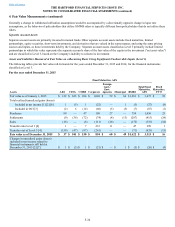
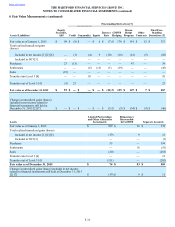
4. Fair Value Measurements (continued)
F-31
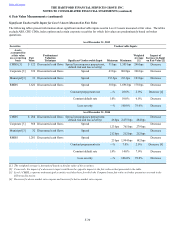
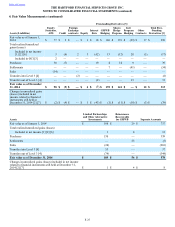
As of December 31, 2015
Freestanding Derivatives Unobservable Inputs
Fair
Value Predominant Valuation
Technique Significant
Unobservable Input Minimum Maximum
Impact of
Increase in In
put on Fair
Value [1]
Interest rate derivative
Interest rate swaps (30) Discounted cash flows Swap curve beyond 30 years 3% 3% Decrease
Interest rate swaptions [2] 8 Option model Interest rate volatility 1% 2% Increase
GMWB hedging instruments
Equity variance swaps (31) Option model Equity volatility 19% 21% Increase
Equity options 35 Option model Equity volatility 27% 29% Increase
Customized swaps 131 Discounted cash flows Equity volatility 10% 40% Increase
Macro hedge program [3]
Equity options 179 Option model Equity volatility 14% 28% Increase
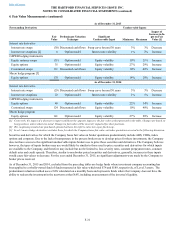
As of December 31, 2014
Interest rate derivative
Interest rate swaps (29) Discounted cash flows Swap curve beyond 30 years 3% 3% Decrease
Interest rate swaptions 22 Option model Interest rate volatility 1% 1% Increase
GMWB hedging instruments
Equity options 46 Option model Equity volatility 22% 34% Increase
Customized swaps 124 Discounted cash flows Equity volatility 10% 40% Increase
Macro hedge program
Equity options 141 Option model Equity volatility 27% 28% Increase
[1] Conversely, the impact of a decrease in input would have the opposite impact to the fair value as that presented in the table. Changes are based on
long positions, unless otherwise noted. Changes in fair value will be inversely impacted for short positions.
[2] The swaptions presented are purchased options that have the right to enter into a pay-fixed swap.
[3] Level 3 macro hedge derivatives excludes those for which the Company bases fair value on broker quotations as noted in the following discussion.
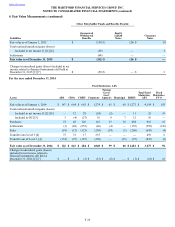
Securities and derivatives for which the Company bases fair value on broker quotations predominately include ABS, CDOs, index
options and corporate. Due to the lack of transparency in the process brokers use to develop prices for these investments, the Company
does not have access to the significant unobservable inputs brokers use to price these securities and derivatives. The Company believes
however, the types of inputs brokers may use would likely be similar to those used to price securities and derivatives for which inputs
are available to the Company, and therefore may include but not be limited to, loss severity rates, constant prepayment rates, constant
default rates and credit spreads. Therefore, similar to non broker priced securities and derivatives, generally, increases in these inputs
would cause fair values to decrease. For the year ended December 31, 2015, no significant adjustments were made by the Company to
broker prices received.
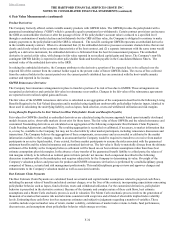
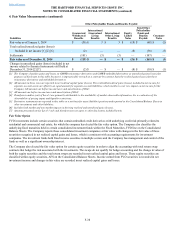
As of December 31, 2015 and 2014, excluded from the preceding tables are hedge funds where investment company accounting has
been applied to a wholly-owned fund of funds measured at fair value which total $74 and $189, respectively, of Level 3 assets. The
predominant valuation method uses a NAV calculated on a monthly basis and represents funds where the Company does not have the
ability to redeem the investment in the near-term at that NAV, including an assessment of the investee's liquidity.