Starwood 2010 Annual Report Download - page 99
Download and view the complete annual report
Please find page 99 of the 2010 Starwood annual report below. You can navigate through the pages in the report by either clicking on the pages listed below, or by using the keyword search tool below to find specific information within the annual report.-
 1
1 -
2
-
3
-
4
-
5
-
6
-
7
-
8
-
9
-
10
-
11
-
12
-
13
-
14
-
15
-
16
-
17
-
18
-
19
-
20
-
21
-
22
-
23
-
24
-
25
-
26
-
27
-
28
-
29
-
30
-
31
-
32
-
33
-
34
-
35
-
36
-
37
-
38
-
39
-
40
-
41
-
42
-
43
-
44
-
45
-
46
-
47
-
48
-
49
-
50
-
51
-
52
-
53
-
54
-
55
-
56
-
57
-
58
-
59
-
60
-
61
-
62
-
63
-
64
-
65
-
66
-
67
-
68
-
69
-
70
-
71
-
72
-
73
-
74
-
75
-
76
-
77
-
78
-
79
-
80
-
81
-
82
-
83
-
84
-
85
-
86
-
87
-
88
-
 89
89 -
 90
90 -
 91
91 -
 92
92 -
 93
93 -
 94
94 -
 95
95 -
 96
96 -
 97
97 -
 98
98 -
 99
99 -
 100
100 -
 101
101 -
 102
102 -
 103
103 -
 104
104 -
 105
105 -
 106
106 -
 107
107 -
 108
108 -
 109
109 -
110
-
111
-
112
-
113
-
114
-
115
-
116
-
117
-
118
-
119
-
120
-
121
-
122
-
123
-
124
-
125
-
126
-
127
-
128
-
129
-
130
-
131
-
132
-
133
-
134
-
135
-
136
-
137
-
138
-
139
-
140
-
141
-
142
-
143
-
144
-
145
-
146
-
147
-
148
-
149
-
150
-
151
-
152
-
153
-
154
-
155
-
156
-
157
-
158
-
159
-
160
-
161
-
162
-
163
-
164
-
165
-
166
-
167
-
168
-
169
-
170
 |
 |

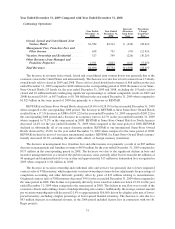
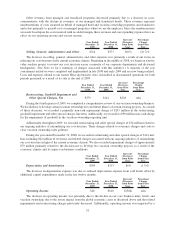
Year Ended December 31, 2009 Compared with Year Ended December 31, 2008
Continuing Operations
Year Ended
December 31,
2009
Year Ended
December 31,
2008
Increase/
(Decrease)
from Prior
Year
Percentage
Change
from Prior
Year
Owned, Leased and Consolidated Joint
Venture Hotels...................... $1,584 $2,212 $ (628) (28.4)%
Management Fees, Franchise Fees and
Other Income ...................... 658 751 (93) (12.4)%
Vacation Ownership and Residential ....... 523 749 (226) (30.2)%
Other Revenues from Managed and
Franchise Properties ................. 1,931 2,042 (111) (5.4)%
Total Revenues ....................... $4,696 $5,754 $(1,058) (18.4)%
The decrease in revenues from owned, leased and consolidated joint venture hotels was primarily due to the
economic crisis in the United States and internationally. The decrease was also due to lost revenues from 15 wholly
owned hotels sold or closed in 2009 and 2008. These sold or closed hotels had revenues of $68 million in the year
ended December 31, 2009 compared to $248 million in the corresponding period of 2008. Revenues at our Same-
Store Owned Hotels (53 hotels for the year ended December 31, 2009 and 2008, excluding the 15 hotels sold or
closed and 10 additional hotels undergoing significant repositionings or without comparable results in 2009 and
2008) decreased 24.0%, or $437 million, to $1.386 billion for the year ended December 31, 2009 when compared to
$1.823 billion in the same period of 2008 due primarily to a decrease in REVPAR.
REVPAR at our Same-Store Owned Hotels decreased 24.6% to $128.95 for the year ended December 31, 2009
when compared to the corresponding 2008 period. The decrease in REVPAR at these Same-Store Owned Hotels
resulted from a 17.1% decrease in ADR to $199.22 for the year ended December 31, 2009 compared to $240.23 for
the corresponding 2008 period and a decrease in occupancy rates to 64.7% in the year ended December 31, 2009
when compared to 71.2% in the same period in 2008. REVPAR at Same-Store Owned Hotels in North America
decreased 24.4% for the year ended December 31, 2009 when compared to the same period of 2008. REVPAR
declined in substantially all of our major domestic markets. REVPAR at our international Same-Store Owned
Hotels decreased by 25.0% for the year ended December 31, 2009 when compared to the same period of 2008.
REVPAR declined in most of our major international markets. REVPAR for Same-Store Owned Hotels interna-
tionally decreased 20.3% excluding the unfavorable effects of foreign currency translation.
The decrease in management fees, franchise fees and other income was primarily a result of an $87 million
decrease in management and franchise revenue to $630 million for the year ended December 31, 2009 compared to
$717 million in the corresponding period in 2008. The decrease was due to the significant decline in base and
incentive management fees as a result of the global economic crisis, partially offset by fees from the net addition of
40 managed and franchised hotels to our system and approximately $15 million in termination fees recognized in
2009 when compared to $4 million in 2008.
The decrease in vacation ownership and residential sales and services was primarily due to lower originated
contract sales of VOI inventory, which represents vacation ownership revenues before adjustments for percentage of
completion accounting and other deferrals, partially offset by gains of $23 million relating to securitizations.
Originated contract sales of VOI inventory decreased 39% for the year ended December 31, 2009 when compared to
the same period in 2008. This decline was primarily driven by lower tour flow which was down 19.2% for the year
ended December 31, 2009 when compared to the same period in 2008. The decline in tour flow was a result of the
economic climate and resulting closure of underperforming sales centers. Additionally, the average contract amount
per vacation ownership unit sold decreased 21.4% to approximately $16,000, driven by a higher sales mix of lower-
priced inventory, including a higher percentage of lower-priced biennial inventory. The decrease is also due to a
$43 million decrease in residential revenue, as the 2008 period included license fees in connection with two St.
Regis projects.
31