Starwood 2010 Annual Report Download - page 50
Download and view the complete annual report
Please find page 50 of the 2010 Starwood annual report below. You can navigate through the pages in the report by either clicking on the pages listed below, or by using the keyword search tool below to find specific information within the annual report.-
 1
1 -
2
-
3
-
4
-
5
-
6
-
7
-
8
-
9
-
10
-
11
-
12
-
13
-
14
-
15
-
16
-
17
-
18
-
19
-
20
-
21
-
22
-
23
-
24
-
25
-
26
-
27
-
28
-
29
-
30
-
31
-
32
-
33
-
34
-
35
-
36
-
37
-
38
-
39
-
 40
40 -
 41
41 -
 42
42 -
 43
43 -
 44
44 -
 45
45 -
 46
46 -
 47
47 -
 48
48 -
 49
49 -
 50
50 -
 51
51 -
 52
52 -
 53
53 -
 54
54 -
 55
55 -
 56
56 -
 57
57 -
 58
58 -
 59
59 -
 60
60 -
61
-
62
-
63
-
64
-
65
-
66
-
67
-
68
-
69
-
70
-
71
-
72
-
73
-
74
-
75
-
76
-
77
-
78
-
79
-
80
-
81
-
82
-
83
-
84
-
85
-
86
-
87
-
88
-
89
-
90
-
91
-
92
-
93
-
94
-
95
-
96
-
97
-
98
-
99
-
100
-
101
-
102
-
103
-
104
-
105
-
106
-
107
-
108
-
109
-
110
-
111
-
112
-
113
-
114
-
115
-
116
-
117
-
118
-
119
-
120
-
121
-
122
-
123
-
124
-
125
-
126
-
127
-
128
-
129
-
130
-
131
-
132
-
133
-
134
-
135
-
136
-
137
-
138
-
139
-
140
-
141
-
142
-
143
-
144
-
145
-
146
-
147
-
148
-
149
-
150
-
151
-
152
-
153
-
154
-
155
-
156
-
157
-
158
-
159
-
160
-
161
-
162
-
163
-
164
-
165
-
166
-
167
-
168
-
169
-
170
 |
 |

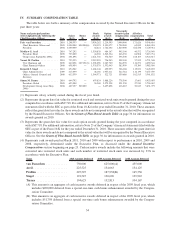
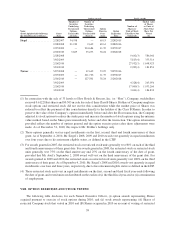
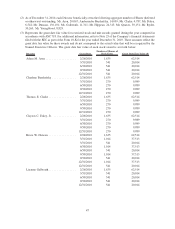
VII. OUTSTANDING EQUITY AWARDS AT FISCAL YEAR-END
The following table provides information on the current holdings of stock options and stock awards by the
Named Executive Officers as of December 31, 2010. This table includes unexercised and unvested stock options,
unvested restricted stock and unvested restricted stock units. Each equity grant is shown separately for each Named
Executive Officer. The market value of the stock awards is based on the closing price of a Share on December 31,
2010, which was $60.78.
Name
(listed alphabetically following
the Chief Executive Officer)
Grant
Date
Number of
Securities
Underlying
Unexercised
Options-
Exercisable
(#)(1)(2)
Number of
Securities
Underlying
Unexercised
Options
Unexercisable
(#)(1)(2)
Option
Exercise
Price
($)(1)
Option
Expiration
Date
Number of
Shares or
Units of Stock
That Have Not
Vested (#)
Market value
of Shares
or Units of
Stock That
Have Not
Vested
($)
Option awards Stock awards
van Paasschen . . . . . . . . . 9/24/2007 47,922 15,973 58.69 9/24/2015
2/28/2008 51,436 51,434 48.61 2/28/2016
2/27/2009 74,484 823,452 11.39 2/27/2017
2/26/2010 — 81,731 38.24 2/26/2018
9/24/2007 31,947(3) 1,941,739
3/02/2009 18,905(4) 1,149,046
2/26/2010 98,078(3) 5,961,181
3/01/2010 14,312(4) 869,883
Avril . . . . . . . . . . . . . . . . 2/28/2007 15,543 5,180 65.15 2/28/2015
2/28/2008 — 11,110 48.61 2/28/2016
2/27/2009 — 247,035 11.39 2/27/2017
2/26/2010 — 32,693 38.24 2/26/2018
2/28/2007 10,361(3) 629,742
2/28/2008 22,220(3) 1,350,532
9/02/2008 40,344(3) 2,452,108
3/02/2009 5,572(4) 338,666
2/26/2010 39,231(3) 2,384,460
3/01/2010 3,528(4) 214,432
Prabhu . . . . . . . . . . . . . . 2/10/2005 40,000 — 48.39 2/10/2013
2/07/2006 79,913 — 48.80 2/07/2014
2/28/2007 25,904 8,634 65.15 2/28/2015
2/28/2008 39,348 39,348 48.61 2/28/2016
2/27/2009 — 205,863 11.39 2/27/2017
2/26/2010 — 49,039 38.24 2/26/2018
2/28/2007 17,269(3) 1,049,610
2/28/2008 26,232(3) 1,594,381
2/27/2009 109,794(3) 6,673,279
3/02/2009 6,056(4) 368,084
2/26/2010 58,847(3) 3,576,721
3/01/2010 4,304(4) 261,597
38