Starwood 2010 Annual Report Download - page 48
Download and view the complete annual report
Please find page 48 of the 2010 Starwood annual report below. You can navigate through the pages in the report by either clicking on the pages listed below, or by using the keyword search tool below to find specific information within the annual report.-
 1
1 -
2
-
3
-
4
-
5
-
6
-
7
-
8
-
9
-
10
-
11
-
12
-
13
-
14
-
15
-
16
-
17
-
18
-
19
-
20
-
21
-
22
-
23
-
24
-
25
-
26
-
27
-
28
-
29
-
30
-
31
-
32
-
33
-
34
-
35
-
36
-
37
-
 38
38 -
 39
39 -
 40
40 -
 41
41 -
 42
42 -
 43
43 -
 44
44 -
 45
45 -
 46
46 -
 47
47 -
 48
48 -
 49
49 -
 50
50 -
 51
51 -
 52
52 -
 53
53 -
 54
54 -
 55
55 -
 56
56 -
 57
57 -
 58
58 -
59
-
60
-
61
-
62
-
63
-
64
-
65
-
66
-
67
-
68
-
69
-
70
-
71
-
72
-
73
-
74
-
75
-
76
-
77
-
78
-
79
-
80
-
81
-
82
-
83
-
84
-
85
-
86
-
87
-
88
-
89
-
90
-
91
-
92
-
93
-
94
-
95
-
96
-
97
-
98
-
99
-
100
-
101
-
102
-
103
-
104
-
105
-
106
-
107
-
108
-
109
-
110
-
111
-
112
-
113
-
114
-
115
-
116
-
117
-
118
-
119
-
120
-
121
-
122
-
123
-
124
-
125
-
126
-
127
-
128
-
129
-
130
-
131
-
132
-
133
-
134
-
135
-
136
-
137
-
138
-
139
-
140
-
141
-
142
-
143
-
144
-
145
-
146
-
147
-
148
-
149
-
150
-
151
-
152
-
153
-
154
-
155
-
156
-
157
-
158
-
159
-
160
-
161
-
162
-
163
-
164
-
165
-
166
-
167
-
168
-
169
-
170
 |
 |

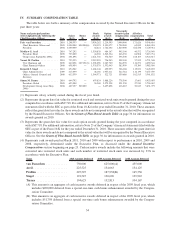
V. GRANTS OF PLAN-BASED AWARDS
The table below sets forth a summary of the grants of plan-based incentive awards to the Named Executive
Officers made during 2010:
Name
(listed alphabetically
by name following the
Chief Executive
Officer) (a)
Grant
date (or
year with
respect to
non-equity
incentive plan
award) (b)(1)
Compensation
Committee
Approval
date
(c)(1)
Threshold
($)(d)
Target
($)(e)
Maximum
($)(f)
All Other
Stock
Awards:
Number of
Shares of
Stock or
Units
(#)(g)
All Other
Option
Awards:
Number of
Securities
Underlying
Options
(#)(h)(3)
Exercise
or Base
Price of
Option
Awards
($/Sh)(i)(4)
Grant Date
Fair Value
of Stock
and Option
Awards
($)(j)(5)
Estimated Future Payouts Under
Non-Equity Incentive Plan Awards(2)
van Paasschen. . . . . . 2/26/2010 2/11/2010 81,731 38.24 1,210,395
2/26/2010 2/11/2010 98,078(7) 3,750,012
3/01/2010 (6) 21,468(6) 831,241
2010 — 2,500,000 3,750,000
Avril . . . . . . . . . . . . 2/26/2010 2/11/2010 32,693 38.24 484,167
2/26/2010 2/11/2010 39,231(7) 1,499,997
3/01/2010 (6) 5,292(6) 204,906
2010 150,350 751,750 2,067,312
Prabhu . . . . . . . . . . 2/26/2010 2/11/2010 49,039 38.24 726,243
2/26/2010 2/11/2010 58,847(7) 2,250,015
3/01/2010 (6) 6,456(6) 249,976
2010 150,350 751,750 2,067,312
Siegel . . . . . . . . . . . 2/26/2010 2/11/2010 31,058 38.24 459,953
2/26/2010 2/11/2010 37,270(7) 1,425,018
3/01/2010 (6) 4,489(6) 173,814
2010 127,698 638,490 1,755,848
Turner . . . . . . . . . . 2/26/2010 2/11/2010 127,501 38.24 1,888,226
2/26/2010 2/11/2010 17,000(7) 649,995
3/01/2010 (6) 4,562(6) 176,641
2010 129,750 648,750 1,784,062
(1) Grant date differs from Compensation Committee approval date in accordance with the procedure outlined in
the discussion on page 32 under the heading Equity Grant Practices.
(2) Represents the potential values of the awards granted to the Named Executive Officers under the Executive Plan
if the threshold, target and maximum goals are satisfied for all applicable performance measures. See detailed
discussion of these awards in section VI. below.
(3) The options generally vest in equal installments on the first, second, third and fourth anniversary of their grant.
As of September 4, 2010, Mr. Siegel’s awards vest quarterly in equal installments over four years due to his
retirement eligible status, as defined in the LTIP.
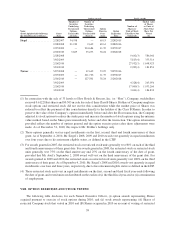
(4) The exercise price was determined by using the average of the high and low price of Shares on the grant date.
(5) Represents the fair value of the awards disclosed in columns (g) and (h) on their respective grant dates. For
restricted stock and restricted stock units, fair value is calculated in accordance with ASC 718 using the average
of the high and low price of Shares on the grant date. For stock options, fair value is calculated in accordance
with ASC 718 using a lattice valuation model. For additional information, refer to Note 23 of the Company’s
financial statements filed with the SEC as part of the Form 10-K for the year ended December 31, 2010. There
can be no assurance that these amounts will correspond to the actual value that will be recognized by the Named
Executive Officers.
(6) On March 1, 2010, in accordance with the Executive Plan, 25% of Messrs. van Paasschen, Avril, Prabhu, Siegel
and Turner’s annual bonus with respect to 2009 performance was converted into restricted stock units and the
number of units was increased by 33%. The amount included in stock awards in the summary compensation
table only includes the 33% increase, as the deferral of the bonus amount is disclosed separately. These
restricted stock units vest in equal installments on the first, second and third fiscal year-ends following the date
of grant, and vested units are distributed on the earlier of (i) the third fiscal year-end or (ii) a termination of
employment. Dividends are paid to the Named Executive Officers in amounts equal to those paid to holders of
36