Starwood 2010 Annual Report Download - page 95
Download and view the complete annual report
Please find page 95 of the 2010 Starwood annual report below. You can navigate through the pages in the report by either clicking on the pages listed below, or by using the keyword search tool below to find specific information within the annual report.-
 1
1 -
2
-
3
-
4
-
5
-
6
-
7
-
8
-
9
-
10
-
11
-
12
-
13
-
14
-
15
-
16
-
17
-
18
-
19
-
20
-
21
-
22
-
23
-
24
-
25
-
26
-
27
-
28
-
29
-
30
-
31
-
32
-
33
-
34
-
35
-
36
-
37
-
38
-
39
-
40
-
41
-
42
-
43
-
44
-
45
-
46
-
47
-
48
-
49
-
50
-
51
-
52
-
53
-
54
-
55
-
56
-
57
-
58
-
59
-
60
-
61
-
62
-
63
-
64
-
65
-
66
-
67
-
68
-
69
-
70
-
71
-
72
-
73
-
74
-
75
-
76
-
77
-
78
-
79
-
80
-
81
-
82
-
83
-
84
-
 85
85 -
 86
86 -
 87
87 -
 88
88 -
 89
89 -
 90
90 -
 91
91 -
 92
92 -
 93
93 -
 94
94 -
 95
95 -
 96
96 -
 97
97 -
 98
98 -
 99
99 -
 100
100 -
 101
101 -
 102
102 -
 103
103 -
 104
104 -
 105
105 -
106
-
107
-
108
-
109
-
110
-
111
-
112
-
113
-
114
-
115
-
116
-
117
-
118
-
119
-
120
-
121
-
122
-
123
-
124
-
125
-
126
-
127
-
128
-
129
-
130
-
131
-
132
-
133
-
134
-
135
-
136
-
137
-
138
-
139
-
140
-
141
-
142
-
143
-
144
-
145
-
146
-
147
-
148
-
149
-
150
-
151
-
152
-
153
-
154
-
155
-
156
-
157
-
158
-
159
-
160
-
161
-
162
-
163
-
164
-
165
-
166
-
167
-
168
-
169
-
170
 |
 |

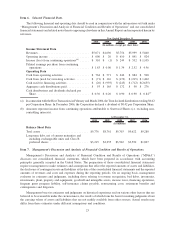
RESULTS OF OPERATIONS
The following discussion presents an analysis of results of our operations for the years ended December 31,
2010, 2009 and 2008.
Business conditions in the global lodging industry were extremely difficult beginning in the middle of 2008
through late 2009, but have improved during 2010. These improvements have resulted from better than expected
occupancy primarily related to our three main classes of customers: business, leisure and group travelers, and the
stabilization of room rates. As corporate profits have continued to rise, our business from the business travelers,
which accounts for the majority of our revenues, is leading the recovery. In addition, the supply side growth has been
lower than recent years which has led us to achieve upper single digit to low double digit REVPAR growth in many
of our leading markets. We are the largest operator of upper upscale and luxury hotels in the world and we are seeing
luxury travel leading the increases in occupancy. Despite the improvement in revenues, we continue to enforce
previously instituted rigorous policies to control costs.
As discussed in Note 2 of the financial statements, following the adoption of ASU Nos. 2009-16 and 2009-17
on January 1, 2010, our statement of income beginning with the year ended December 31, 2010 no longer reflects
securitization income, but instead reports interest income, net charge-offs and certain other income associated with
all securitized loan receivables, and interest expense associated with debt issued from the trusts to third-party
investors in the same line items in our statement of income as debt. Additionally, we will no longer record initial
gains or losses on new securitization activity since securitized vacation ownership notes receivable no longer
receive sale accounting treatment. Finally, we no longer recognize gains or losses on the revaluation of the interest-
only strip receivable as that asset is not recognized in a transaction accounted for as a secured borrowing.
Our statement of income for the year ended December 31, 2009 and our balance sheet as of December 31, 2009
have not been retrospectively adjusted to reflect the adoption of ASU Nos. 2009-16 and 2009-17. Therefore, current
period results will not be comparable to prior period amounts, particularly with regards to:
• Vacation ownership and residential sales and services
• Interest expense
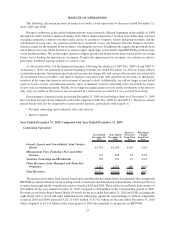
Year Ended December 31, 2010 Compared with Year Ended December 31, 2009
Continuing Operations
Year Ended
December 31,
2010
Year Ended
December 31,
2009
Increase /
(Decrease)
from Prior
Year
Percentage
Change
from Prior
Year
Owned, Leased and Consolidated Joint Venture
Hotels................................. $1,704 $1,584 $120 7.6%
Management Fees, Franchise Fees and Other
Income ................................ 712 658 54 8.2%
Vacation Ownership and Residential ........... 538 523 15 2.9%
Other Revenues from Managed and Franchise
Properties .............................. 2,117 1,931 186 9.6%
Total Revenues ............................ $5,071 $4,696 $375 8.0%
The increase in revenues from owned, leased and consolidated joint venture hotels was primarily due to improved
REVPAR (as discussed below) at our existing owned, leased and consolidated joint venture hotels, offset in part by lost
revenues from eight wholly owned hotels sold or closed in 2010 and 2009. These sold or closed hotels had revenues of
$18 million in the year ended December 31, 2010 compared to $98 million in the corresponding period of 2009.
Revenues at our Same-Store Owned Hotels (54 hotels for the year ended December 31, 2010 and 2009, excluding the
eight hotels sold or closed and eight additional hotels undergoing significant repositionings or without comparable
results in 2010 and 2009) increased 8.2%, or $107 million, to $1.421 billion for the year ended December 31, 2010
when compared to $1.314 billion in the same period of 2009 due primarily to an increase in REVPAR.
27