Starwood 2010 Annual Report Download - page 46
Download and view the complete annual report
Please find page 46 of the 2010 Starwood annual report below. You can navigate through the pages in the report by either clicking on the pages listed below, or by using the keyword search tool below to find specific information within the annual report.-
 1
1 -
2
-
3
-
4
-
5
-
6
-
7
-
8
-
9
-
10
-
11
-
12
-
13
-
14
-
15
-
16
-
17
-
18
-
19
-
20
-
21
-
22
-
23
-
24
-
25
-
26
-
27
-
28
-
29
-
30
-
31
-
32
-
33
-
34
-
35
-
 36
36 -
 37
37 -
 38
38 -
 39
39 -
 40
40 -
 41
41 -
 42
42 -
 43
43 -
 44
44 -
 45
45 -
 46
46 -
 47
47 -
 48
48 -
 49
49 -
 50
50 -
 51
51 -
 52
52 -
 53
53 -
 54
54 -
 55
55 -
 56
56 -
57
-
58
-
59
-
60
-
61
-
62
-
63
-
64
-
65
-
66
-
67
-
68
-
69
-
70
-
71
-
72
-
73
-
74
-
75
-
76
-
77
-
78
-
79
-
80
-
81
-
82
-
83
-
84
-
85
-
86
-
87
-
88
-
89
-
90
-
91
-
92
-
93
-
94
-
95
-
96
-
97
-
98
-
99
-
100
-
101
-
102
-
103
-
104
-
105
-
106
-
107
-
108
-
109
-
110
-
111
-
112
-
113
-
114
-
115
-
116
-
117
-
118
-
119
-
120
-
121
-
122
-
123
-
124
-
125
-
126
-
127
-
128
-
129
-
130
-
131
-
132
-
133
-
134
-
135
-
136
-
137
-
138
-
139
-
140
-
141
-
142
-
143
-
144
-
145
-
146
-
147
-
148
-
149
-
150
-
151
-
152
-
153
-
154
-
155
-
156
-
157
-
158
-
159
-
160
-
161
-
162
-
163
-
164
-
165
-
166
-
167
-
168
-
169
-
170
 |
 |

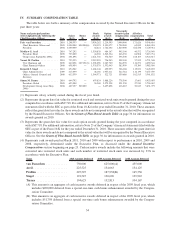
IV. SUMMARY COMPENSATION TABLE
The table below sets forth a summary of the compensation received by the Named Executive Officers for the
past three years:
Name and principal position
(listed alphabetically following the
Chief Executive Officer) Year
Salary
($)(1)
Bonus
($)
Stock
awards
($)(2)
Option
awards
($)(3)
Non-equity
incentive plan
compensation
($)(4)
All other
compensation
($)(5)
Total
($)
Frits van Paasschen ........... 2010 1,208,333 — 3,956,262 1,210,395 3,000,000 171,626 9,546,616
Chief Executive Officer and 2009 1,000,000 800,000(6) 150,125 5,151,077 1,700,000 63,832 8,865,034
President 2008 1,000,000 — 44,421 1,742,402 1,820,000 522,538 5,129,361
Matthew E. Avril ............. 2010 747,292 — 1,550,838 484,167 902,100 40,572 3,724,969
President, Hotel 2009 725,000 — 44,269 1,545,324 616,250 82,908 3,013,751
Group (since September 2008) 2008 601,896 — 2,621,756 376,360 536,500 188,103 4,324,615
Vasant M. Prabhu............. 2010 733,235 — 2,312,035 726,243 902,100 57,935 4,731,548
Vice Chairman and 2009 640,658 207,191(6) 1,298,096 1,287,769 544,559 112,271 4,090,544
Chief Financial Officer 2008 638,054 — 1,335,578 1,332,945 582,999 93,380 3,982,956
Kenneth S. Siegel ............. 2010 634,582 — 1,468,148 459,953 766,188 115,021 3,443,892
Chief Administrative 2009 615,039 — 46,166 1,957,411 522,784 116,139 3,257,539
Officer, General Counsel and
Secretary
2008 612,539 — 1,564,371 522,721 559,686 102,515 3,361,832
Simon M. Turner ............. 2010 644,792 — 693,824 1,888,226 778,500 17,661 4,023,003
President, Global 2009 625,000 — 34,369 2,575,538 531,250 27,910 3,794,067
Development Group (since May
2008)
2008 407,197 500,000 — 2,497,898 416,667 30,013 3,851,775
(1) Represents salary actually earned during the fiscal year listed.
(2) Represents the grant date fair value for restricted stock and restricted stock unit awards granted during the year
computed in accordance with ASC 718. For additional information, refer to Note 23 of the Company’s financial
statements filed with the SEC as part of the Form 10-K for the year ended December 31, 2010. These amounts
reflect the grant date fair value for these awards and do not correspond to the actual value that will be recognized
by the Named Executive Officers. See the Grants of Plan-Based Awards Table on page 36 for information on
awards granted in 2010.
(3) Represents the grant date fair value for stock option awards granted during the year computed in accordance
with ASC 718. For additional information, refer to Note 23 of the Company’s financial statements filed with the
SEC as part of the Form 10-K for the year ended December 31, 2010. These amounts reflect the grant date fair
value for these awards and do not correspond to the actual value that will be recognized by the Named Executive
Officers. See the Grants of Plan-Based Awards Table on page 36 for information on awards granted in 2010.
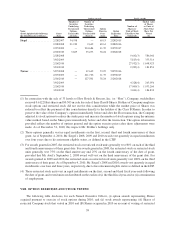
(4) Represents cash awards paid in March 2011, 2010 and 2009 with respect to performance in 2010, 2009 and
2008, respectively, determined under the Executive Plan, as discussed under the Annual Incentive
Compensation section beginning on page 23. Cash incentive awards include the following amounts that were
converted into restricted stock units and such number of restricted stock units was increased by 33% in
accordance with the Executive Plan:
Name 2010 Amount Deferred 2009 Amount Deferred 2008 Amount Deferred
van Paasschen ............. 750,000 625,000(A) 455,000
Avril ..................... 225,525 154,063 134,125
Prabhu ................... 225,525 187,938(B) 145,750
Siegel .................... 191,547 130,696 139,922
Turner ................... 194,625 132,813 104,167
(A) This amount is an aggregate of cash incentive awards deferred in respect of the 2009 fiscal year, which
includes $200,000 deferred from a special one-time cash bonus enhancement awarded by the Compen-
sation Committee.
(B) This amount is an aggregate of cash incentive awards deferred in respect of the 2009 fiscal year, which
includes $51,798 deferred from a special one-time cash bonus enhancement awarded by the Compen-
sation Committee.
34