Starwood 2010 Annual Report Download - page 102
Download and view the complete annual report
Please find page 102 of the 2010 Starwood annual report below. You can navigate through the pages in the report by either clicking on the pages listed below, or by using the keyword search tool below to find specific information within the annual report.-
 1
1 -
2
-
3
-
4
-
5
-
6
-
7
-
8
-
9
-
10
-
11
-
12
-
13
-
14
-
15
-
16
-
17
-
18
-
19
-
20
-
21
-
22
-
23
-
24
-
25
-
26
-
27
-
28
-
29
-
30
-
31
-
32
-
33
-
34
-
35
-
36
-
37
-
38
-
39
-
40
-
41
-
42
-
43
-
44
-
45
-
46
-
47
-
48
-
49
-
50
-
51
-
52
-
53
-
54
-
55
-
56
-
57
-
58
-
59
-
60
-
61
-
62
-
63
-
64
-
65
-
66
-
67
-
68
-
69
-
70
-
71
-
72
-
73
-
74
-
75
-
76
-
77
-
78
-
79
-
80
-
81
-
82
-
83
-
84
-
85
-
86
-
87
-
88
-
89
-
90
-
91
-
 92
92 -
 93
93 -
 94
94 -
 95
95 -
 96
96 -
 97
97 -
 98
98 -
 99
99 -
 100
100 -
 101
101 -
 102
102 -
 103
103 -
 104
104 -
 105
105 -
 106
106 -
 107
107 -
 108
108 -
 109
109 -
 110
110 -
 111
111 -
 112
112 -
113
-
114
-
115
-
116
-
117
-
118
-
119
-
120
-
121
-
122
-
123
-
124
-
125
-
126
-
127
-
128
-
129
-
130
-
131
-
132
-
133
-
134
-
135
-
136
-
137
-
138
-
139
-
140
-
141
-
142
-
143
-
144
-
145
-
146
-
147
-
148
-
149
-
150
-
151
-
152
-
153
-
154
-
155
-
156
-
157
-
158
-
159
-
160
-
161
-
162
-
163
-
164
-
165
-
166
-
167
-
168
-
169
-
170
 |
 |
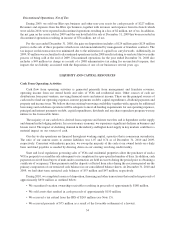
Discontinued Operations, Net of Tax
During 2009, we sold our Bliss spa business and other non-core assets for cash proceeds of $227 million.
Revenues and expenses from the Bliss spa business, together with revenues and expenses from two hotels which
were sold in 2010, were reported in discontinued operations resulting in a loss of $2 million, net of tax. In addition,
the net gain on the assets sold in 2009 and the one hotel held for sale at December 31, 2009 has been recorded in
discontinued operations resulting in income of $76 million, net of tax.
For the year ended December 31, 2008, the gain on dispositions includes a $124 million gain ($129 million
pretax) on the sale of three properties which were sold unencumbered by management or franchise contracts. The
tax impact on this transaction was minimized due to the utilization of capital loss carryforwards. Additionally, in
2009, $5 million was reclassified to discontinued operations (in the 2008 results) relating to one hotel that was in the
process of being sold at the end of 2009. Discontinued operations for the year ended December 31, 2008 also
includes a $49 million tax charge as a result of a 2008 administrative tax ruling for an unrelated taxpayer, that
impacts the tax liability associated with the disposition of one of our businesses several years ago.
LIQUIDITY AND CAPITAL RESOURCES
Cash From Operating Activities
Cash flow from operating activities is generated primarily from management and franchise revenues,
operating income from our owned hotels and sales of VOIs and residential units. Other sources of cash are
distributions from joint ventures, servicing financial assets and interest income. These are the principal sources of
cash used to fund our operating expenses, interest payments on debt, capital expenditures, dividend payments and
property and income taxes. We believe that our existing borrowing availability together with capacity for additional
borrowings and cash from operations will be adequate to meet all funding requirements for our operating expenses,
principal and interest payments on debt, capital expenditures, dividends and any share repurchase program we may
initiate in the foreseeable future.
The majority of our cash flow is derived from corporate and leisure travelers and is dependent on the supply
and demand in the lodging industry. In a recessionary economy, we experience significant declines in business and
leisure travel. The impact of declining demand in the industry and higher hotel supply in key markets could have a
material impact on our sources of cash.
Our day-to-day operations are financed through net working capital, a practice that is common in our industry.
The ratio of our current assets to current liabilities was 1.07 and 0.74 as of December 31, 2010 and 2009,
respectively. Consistent with industry practice, we sweep the majority of the cash at our owned hotels on a daily
basis and fund payables as needed by drawing down on our existing revolving credit facility.
State and local regulations governing sales of VOIs and residential properties allow the purchaser of such a
VOI or property to rescind the sale subsequent to its completion for a pre-specified number of days. In addition, cash
payments received from buyers of units under construction are held in escrow during the period prior to obtaining a
certificate of occupancy. These payments and the deposits collected from sales during the rescission period are the
primary components of our restricted cash balances in our consolidated balance sheets. At December 31, 2010 and
2009, we had short-term restricted cash balances of $53 million and $47 million, respectively.
During 2010, we completed a series of disposition, financing and other transactions that resulted in proceeds of
approximately $650 million as outlined below:
• We securitized vacation ownership receivables resulting in proceeds of approximately $180 million.
• We sold assets that resulted in cash proceeds of approximately $150 million.
• We received a tax refund from the IRS of $245 million (see Note 15).
• We received proceeds of $75 million as a result of the favorable settlement of a lawsuit.
34