Starwood 2010 Annual Report Download - page 87
Download and view the complete annual report
Please find page 87 of the 2010 Starwood annual report below. You can navigate through the pages in the report by either clicking on the pages listed below, or by using the keyword search tool below to find specific information within the annual report.-
 1
1 -
2
-
3
-
4
-
5
-
6
-
7
-
8
-
9
-
10
-
11
-
12
-
13
-
14
-
15
-
16
-
17
-
18
-
19
-
20
-
21
-
22
-
23
-
24
-
25
-
26
-
27
-
28
-
29
-
30
-
31
-
32
-
33
-
34
-
35
-
36
-
37
-
38
-
39
-
40
-
41
-
42
-
43
-
44
-
45
-
46
-
47
-
48
-
49
-
50
-
51
-
52
-
53
-
54
-
55
-
56
-
57
-
58
-
59
-
60
-
61
-
62
-
63
-
64
-
65
-
66
-
67
-
68
-
69
-
70
-
71
-
72
-
73
-
74
-
75
-
76
-
 77
77 -
 78
78 -
 79
79 -
 80
80 -
 81
81 -
 82
82 -
 83
83 -
 84
84 -
 85
85 -
 86
86 -
 87
87 -
 88
88 -
 89
89 -
 90
90 -
 91
91 -
 92
92 -
 93
93 -
 94
94 -
 95
95 -
 96
96 -
 97
97 -
98
-
99
-
100
-
101
-
102
-
103
-
104
-
105
-
106
-
107
-
108
-
109
-
110
-
111
-
112
-
113
-
114
-
115
-
116
-
117
-
118
-
119
-
120
-
121
-
122
-
123
-
124
-
125
-
126
-
127
-
128
-
129
-
130
-
131
-
132
-
133
-
134
-
135
-
136
-
137
-
138
-
139
-
140
-
141
-
142
-
143
-
144
-
145
-
146
-
147
-
148
-
149
-
150
-
151
-
152
-
153
-
154
-
155
-
156
-
157
-
158
-
159
-
160
-
161
-
162
-
163
-
164
-
165
-
166
-
167
-
168
-
169
-
170
 |
 |

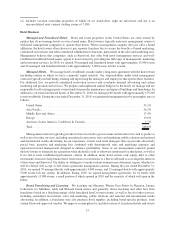
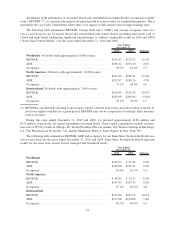
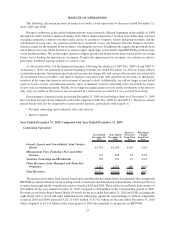
An indicator of the performance of our owned, leased and consolidated joint venture hotels is revenue per available
room (“REVPAR”)
(1)
, as it measures the period-over-period growth in rooms revenue for comparable properties. This is
particularly the case in the United States where there is no impact on this measure from foreign exchange rates.
The following table summarizes REVPAR, average daily rates (“ADR”) and average occupancy rates on a
year-to-year basis for our 54 owned, leased and consolidated joint venture hotels (excluding nine hotels sold or
closed and eight hotels undergoing significant repositionings or without comparable results in 2010 and 2009)
(“Same-Store Owned Hotels”) for the years ended December 31, 2010 and 2009:
2010 2009 Variance
Year Ended
December 31,
Worldwide (54 hotels with approximately 19,000 rooms)
REVPAR ............................................ $136.27 $122.57 11.2%
ADR............................................... $196.62 $191.60 2.6%
Occupancy ........................................... 69.3% 64.0% 5.3
North America (28 hotels with approximately 12,000 rooms)
REVPAR ............................................ $141.02 $126.41 11.6%
ADR............................................... $192.97 $184.26 4.7%
Occupancy ........................................... 73.1% 68.6% 4.5
International (26 hotels with approximately 7,000 rooms)
REVPAR ............................................ $129.05 $116.74 10.5%
ADR............................................... $202.99 $205.04 (1.0)%
Occupancy ........................................... 63.6% 56.9% 6.7
(1) REVPAR is calculated by dividing room revenue, which is derived from rooms and suites rented or leased, by
total room nights available for a given period. REVPAR may not be comparable to similarly titled measures
such as revenues.
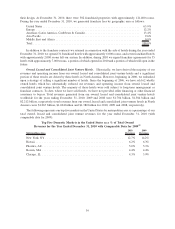
During the years ended December 31, 2010 and 2009, we invested approximately $184 million and
$171 million, respectively, for capital expenditures at owned hotels. These capital expenditures include construc-
tion costs at W City Center in Chicago, IL, Westin Peachtree Plaza in Atlanta, GA, Westin Gaslamp in San Diego,
CA, The Phoenician in Scottsdale, AZ, and the Manhattan Hotel at Times Square in New York, NY.
The following table summarizes REVPAR, ADR and occupancy for our Same-Store Systemwide Hotels on a
year-to-year basis for the years ended December 31, 2010 and 2009. Same-Store Systemwide Hotels represent
results for the same store owned, leased, managed and franchised hotels.
2010 2009 Variance
Year Ended
December 31,
Worldwide
REVPAR ............................................ $106.57 $ 97.45 9.4%
ADR............................................... $160.00 $158.51 0.9%
Occupancy ........................................... 66.6% 61.5% 5.1
North America
REVPAR ............................................ $ 99.81 $ 92.17 8.3%
ADR............................................... $147.99 $147.29 0.5%
Occupancy ........................................... 67.4% 62.6% 4.8
International
REVPAR ............................................ $115.90 $104.75 10.6%
ADR............................................... $177.08 $174.68 1.4%
Occupancy ........................................... 65.5% 60.0% 5.5
19