Starwood 2010 Annual Report Download - page 84
Download and view the complete annual report
Please find page 84 of the 2010 Starwood annual report below. You can navigate through the pages in the report by either clicking on the pages listed below, or by using the keyword search tool below to find specific information within the annual report.-
 1
1 -
2
-
3
-
4
-
5
-
6
-
7
-
8
-
9
-
10
-
11
-
12
-
13
-
14
-
15
-
16
-
17
-
18
-
19
-
20
-
21
-
22
-
23
-
24
-
25
-
26
-
27
-
28
-
29
-
30
-
31
-
32
-
33
-
34
-
35
-
36
-
37
-
38
-
39
-
40
-
41
-
42
-
43
-
44
-
45
-
46
-
47
-
48
-
49
-
50
-
51
-
52
-
53
-
54
-
55
-
56
-
57
-
58
-
59
-
60
-
61
-
62
-
63
-
64
-
65
-
66
-
67
-
68
-
69
-
70
-
71
-
72
-
73
-
 74
74 -
 75
75 -
 76
76 -
 77
77 -
 78
78 -
 79
79 -
 80
80 -
 81
81 -
 82
82 -
 83
83 -
 84
84 -
 85
85 -
 86
86 -
 87
87 -
 88
88 -
 89
89 -
 90
90 -
 91
91 -
 92
92 -
 93
93 -
 94
94 -
95
-
96
-
97
-
98
-
99
-
100
-
101
-
102
-
103
-
104
-
105
-
106
-
107
-
108
-
109
-
110
-
111
-
112
-
113
-
114
-
115
-
116
-
117
-
118
-
119
-
120
-
121
-
122
-
123
-
124
-
125
-
126
-
127
-
128
-
129
-
130
-
131
-
132
-
133
-
134
-
135
-
136
-
137
-
138
-
139
-
140
-
141
-
142
-
143
-
144
-
145
-
146
-
147
-
148
-
149
-
150
-
151
-
152
-
153
-
154
-
155
-
156
-
157
-
158
-
159
-
160
-
161
-
162
-
163
-
164
-
165
-
166
-
167
-
168
-
169
-
170
 |
 |

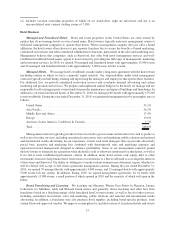
their design. At December 31, 2010, there were 502 franchised properties with approximately 121,400 rooms.
During the year ended December 31, 2010, we generated franchise fees by geographic area as follows:
United States ............................................................ 63.9%
Europe ................................................................ 12.2%
Americas (Latin America, Caribbean & Canada).................................. 13.4%
Asia Pacific ............................................................. 9.6%
Middle East and Africa . ................................................... 0.9%
Total .................................................................. 100.0%
In addition to the franchise contracts we retained in connection with the sale of hotels during the year ended
December 31, 2010, we opened 31 franchised hotels with approximately 6,000 rooms, and seven franchised hotels
with approximately 2,000 rooms left our system. In addition, during 2010 we signed franchise agreements for 35
hotels with approximately 7,000 rooms, a portion of which opened in 2010 and a portion of which will open in the
future.
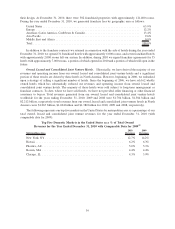
Owned, Leased and Consolidated Joint Venture Hotels. Historically, we have derived the majority of our
revenues and operating income from our owned, leased and consolidated joint venture hotels and a significant
portion of these results are driven by these hotels in North America. However, beginning in 2006, we embarked
upon a strategy of selling a significant number of hotels. Since the beginning of 2006, we have sold 62 wholly
owned hotels which has substantially reduced our revenues and operating income from owned, leased and
consolidated joint venture hotels. The majority of these hotels were sold subject to long-term management or
franchise contracts. To date, where we have sold hotels, we have not provided seller financing or other financial
assistance to buyers. Total revenues generated from our owned, leased and consolidated joint venture hotels
worldwide for the years ending December 31, 2010, 2009 and 2008 were $1.704 billion, $1.584 billion and
$2.212 billion, respectively (total revenues from our owned, leased and consolidated joint venture hotels in North
America were $1.067 billion, $1.024 billion and $1.380 billion for 2010, 2009 and 2008, respectively).
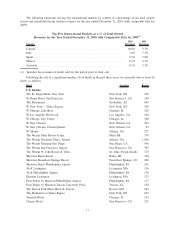
The following represents our top five markets in the United States by metropolitan area as a percentage of our
total owned, leased and consolidated joint venture revenues for the year ended December 31, 2010 (with
comparable data for 2009):
Top Five Domestic Markets in the United States as a % of Total Owned
Revenues for the Year Ended December 31, 2010 with Comparable Data for 2009
(1)
Metropolitan Area
2010
Revenues
2009
Revenues
New York, NY ................................................ 12.7% 14.2%
Hawaii ...................................................... 6.2% 6.3%
Phoenix, AZ .................................................. 5.0% 5.1%
Boston, MA .................................................. 4.4% 4.4%
Chicago, IL .................................................. 4.3% 3.9%
16