Starwood 2010 Annual Report Download - page 122
Download and view the complete annual report
Please find page 122 of the 2010 Starwood annual report below. You can navigate through the pages in the report by either clicking on the pages listed below, or by using the keyword search tool below to find specific information within the annual report.-
 1
1 -
2
-
3
-
4
-
5
-
6
-
7
-
8
-
9
-
10
-
11
-
12
-
13
-
14
-
15
-
16
-
17
-
18
-
19
-
20
-
21
-
22
-
23
-
24
-
25
-
26
-
27
-
28
-
29
-
30
-
31
-
32
-
33
-
34
-
35
-
36
-
37
-
38
-
39
-
40
-
41
-
42
-
43
-
44
-
45
-
46
-
47
-
48
-
49
-
50
-
51
-
52
-
53
-
54
-
55
-
56
-
57
-
58
-
59
-
60
-
61
-
62
-
63
-
64
-
65
-
66
-
67
-
68
-
69
-
70
-
71
-
72
-
73
-
74
-
75
-
76
-
77
-
78
-
79
-
80
-
81
-
82
-
83
-
84
-
85
-
86
-
87
-
88
-
89
-
90
-
91
-
92
-
93
-
94
-
95
-
96
-
97
-
98
-
99
-
100
-
101
-
102
-
103
-
104
-
105
-
106
-
107
-
108
-
109
-
110
-
111
-
 112
112 -
 113
113 -
 114
114 -
 115
115 -
 116
116 -
 117
117 -
 118
118 -
 119
119 -
 120
120 -
 121
121 -
 122
122 -
 123
123 -
 124
124 -
 125
125 -
 126
126 -
 127
127 -
 128
128 -
 129
129 -
 130
130 -
 131
131 -
 132
132 -
133
-
134
-
135
-
136
-
137
-
138
-
139
-
140
-
141
-
142
-
143
-
144
-
145
-
146
-
147
-
148
-
149
-
150
-
151
-
152
-
153
-
154
-
155
-
156
-
157
-
158
-
159
-
160
-
161
-
162
-
163
-
164
-
165
-
166
-
167
-
168
-
169
-
170
 |
 |

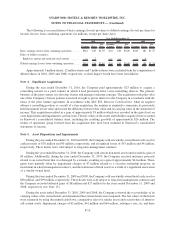
STARWOOD HOTELS & RESORTS WORLDWIDE, INC.
CONSOLIDATED STATEMENTS OF EQUITY
Shares Amount
Additional
Paid-in
Capital
(1)
Accumulated
Other
Comprehensive
(Loss)
Income
(2)
Retained
Earnings
Equity
Attributable to
Noncontrolling
Interests Total
Shares
Equity Attributable to Starwood Stockholders
(In millions)
Balance at December 31, 2007....... 191 $ 2 $868 $(147) $1,353 $26 $2,102
Net income (loss) ................ — — — — 329 — 329
Stock option and restricted stock award
transactions, net ................ 6 — 212 — — — 212
ESPP stock issuances.............. — — 6 — — — 6
Share repurchases ................ (14) — (593) — — — (593)
Other . ........................ — — — — — (2) (2)
Other comprehensive income (loss) . . . — — — (244) — — (244)
Dividends declared ............... — — — — (165) (1) (166)
Balance at December 31, 2008....... 183 2 493 (391) 1,517 23 1,644
Net income (loss) ................ — — — — 73 (2) 71
Stock option and restricted stock award
transactions, net ................ 4 — 54 — — — 54
ESPP stock issuances.............. — — 5 — — — 5
Other comprehensive income (loss) . . . — — — 108 — 1 109
Dividends declared ............... — — — — (37) (1) (38)
Balance at December 31, 2009....... 187 2 552 (283) 1,553 21 1,845
Net income (loss) ................ — — — — 477 (2) 475
Stock option and restricted stock award
transactions, net ................ 6 — 248 — — — 248
ESPP stock issuances.............. — — 5 — — — 5
Impact of adoption of ASU
No. 2009-17 .................. — — — — (26) — (26)
Other comprehensive income (loss) . . . — — — — — (1) (1)
Dividends declared ............... — — — — (57) (3) (60)
Balance at December 31, 2010....... 193 $ 2 $805 $(283) $1,947 $15 $2,486
(1) Stock option and restricted stock award transactions are net of a tax (expense) benefit of $28 million, ($18) million and $33 million in 2010,
2009, and 2008 respectively.
(2) As of December 31, 2010, this balance is comprised of $227 million of cumulative translation adjustments and $56 million of cumulative
pension adjustments.
The accompanying notes to financial statements are an integral part of the above statements.
F-6