Starwood 2010 Annual Report Download - page 104
Download and view the complete annual report
Please find page 104 of the 2010 Starwood annual report below. You can navigate through the pages in the report by either clicking on the pages listed below, or by using the keyword search tool below to find specific information within the annual report.-
 1
1 -
2
-
3
-
4
-
5
-
6
-
7
-
8
-
9
-
10
-
11
-
12
-
13
-
14
-
15
-
16
-
17
-
18
-
19
-
20
-
21
-
22
-
23
-
24
-
25
-
26
-
27
-
28
-
29
-
30
-
31
-
32
-
33
-
34
-
35
-
36
-
37
-
38
-
39
-
40
-
41
-
42
-
43
-
44
-
45
-
46
-
47
-
48
-
49
-
50
-
51
-
52
-
53
-
54
-
55
-
56
-
57
-
58
-
59
-
60
-
61
-
62
-
63
-
64
-
65
-
66
-
67
-
68
-
69
-
70
-
71
-
72
-
73
-
74
-
75
-
76
-
77
-
78
-
79
-
80
-
81
-
82
-
83
-
84
-
85
-
86
-
87
-
88
-
89
-
90
-
91
-
92
-
93
-
 94
94 -
 95
95 -
 96
96 -
 97
97 -
 98
98 -
 99
99 -
 100
100 -
 101
101 -
 102
102 -
 103
103 -
 104
104 -
 105
105 -
 106
106 -
 107
107 -
 108
108 -
 109
109 -
 110
110 -
 111
111 -
 112
112 -
 113
113 -
 114
114 -
115
-
116
-
117
-
118
-
119
-
120
-
121
-
122
-
123
-
124
-
125
-
126
-
127
-
128
-
129
-
130
-
131
-
132
-
133
-
134
-
135
-
136
-
137
-
138
-
139
-
140
-
141
-
142
-
143
-
144
-
145
-
146
-
147
-
148
-
149
-
150
-
151
-
152
-
153
-
154
-
155
-
156
-
157
-
158
-
159
-
160
-
161
-
162
-
163
-
164
-
165
-
166
-
167
-
168
-
169
-
170
 |
 |

We periodically review our business to identify properties or other assets that we believe either are non-core
(including hotels where the return on invested capital is not adequate), no longer complement our business, are in
markets which may not benefit us as much as other markets during an economic recovery or could be sold at
significant premiums. We are focused on enhancing real estate returns and monetizing investments.
Since 2006, we have sold 62 hotels realizing proceeds of approximately $5.3 billion in numerous transactions
(see Note 5 of the consolidated financial statements). There can be no assurance, however, that we will be able to
complete future dispositions on commercially reasonable terms or at all.
The 2010 asset sales resulted in gross cash proceeds from investing activities of approximately $150 million
and are discussed in our general liquidity discussion under cash used for financing activities.
Cash Used for Financing Activities
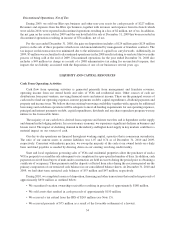
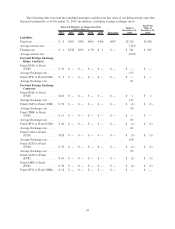
The following is a summary of our debt portfolio (including capital leases) as of December 31, 2010:
Amount
Outstanding at
December 31,
2010
(a)
Interest Rate at
December 31,
2010
Average
Maturity
(Dollars in millions) (In years)
Floating Rate Debt
Revolving Credit Facilities .................... $ — — 2.8
Mortgages and Other . . . ..................... 41 5.99% 2.3
Interest Rate Swaps ......................... 500 4.83%
Total/Average ............................. $ 541 4.92% 2.3
Fixed Rate Debt
Senior Notes .............................. $2,698 7.26% 4.1
Mortgages and Other . . . ..................... 118 7.56% 7.2
Interest Rate Swaps ......................... (500) 7.06%
Total/Average ............................. $2,316 7.31% 4.2
Total Debt
Total Debt and Average Terms ................. $2,857 6.86% 4.2
(a) Excludes approximately $434 million of our share of unconsolidated joint venture debt and securitized
vacation ownership debt of $494 million, all of which is non-recourse.
For specifics related to our financing transactions, issuances, and terms entered into for the years ended
December 31, 2010 and 2009, see Note 16 of the consolidated financial statements. We have evaluated the
commitments of each of the lenders in our Revolving Credit Facilities (the “Facilities”). In addition, we have
reviewed our debt covenants and do not anticipate any issues regarding the availability of funds under the Facilities.
On April 20, 2010, we executed a new $1.5 billion Senior Credit Facility (“New Facility”). The New Facility
matures on November 15, 2013 and replaces the former $1.875 billion Revolving Credit Agreement, which would
have matured on February 11, 2011.
Due to the adoption of ASU Nos. 2009-16 and 2009-17, as discussed in Notes 2, 10, and 11, our 2010 cash
flows from financing activities include the borrowings and repayments of securitized vacation ownership debt.
During 2010, as previously described in Cash from Operating Activities, we completed a series of disposition,
financing and other transactions that resulted in proceeds of approximately $650 million. As a result of these
transactions and cash flow from operations, net debt was reduced to $2.060 billion compared to net debt of
$2.819 billion as of December 31, 2009. Our gross debt at December 31, 2010 was $2.857 billion, excluding debt
associated with securitized vacation ownership notes receivable. Additionally, we had cash and cash equivalents of
$797 million (including $44 million of restricted cash) at December 31, 2010. As discussed earlier, we adopted
36