Starwood 2010 Annual Report Download - page 132
Download and view the complete annual report
Please find page 132 of the 2010 Starwood annual report below. You can navigate through the pages in the report by either clicking on the pages listed below, or by using the keyword search tool below to find specific information within the annual report.-
 1
1 -
2
-
3
-
4
-
5
-
6
-
7
-
8
-
9
-
10
-
11
-
12
-
13
-
14
-
15
-
16
-
17
-
18
-
19
-
20
-
21
-
22
-
23
-
24
-
25
-
26
-
27
-
28
-
29
-
30
-
31
-
32
-
33
-
34
-
35
-
36
-
37
-
38
-
39
-
40
-
41
-
42
-
43
-
44
-
45
-
46
-
47
-
48
-
49
-
50
-
51
-
52
-
53
-
54
-
55
-
56
-
57
-
58
-
59
-
60
-
61
-
62
-
63
-
64
-
65
-
66
-
67
-
68
-
69
-
70
-
71
-
72
-
73
-
74
-
75
-
76
-
77
-
78
-
79
-
80
-
81
-
82
-
83
-
84
-
85
-
86
-
87
-
88
-
89
-
90
-
91
-
92
-
93
-
94
-
95
-
96
-
97
-
98
-
99
-
100
-
101
-
102
-
103
-
104
-
105
-
106
-
107
-
108
-
109
-
110
-
111
-
112
-
113
-
114
-
115
-
116
-
117
-
118
-
119
-
120
-
121
-
 122
122 -
 123
123 -
 124
124 -
 125
125 -
 126
126 -
 127
127 -
 128
128 -
 129
129 -
 130
130 -
 131
131 -
 132
132 -
 133
133 -
 134
134 -
 135
135 -
 136
136 -
 137
137 -
 138
138 -
 139
139 -
 140
140 -
 141
141 -
 142
142 -
143
-
144
-
145
-
146
-
147
-
148
-
149
-
150
-
151
-
152
-
153
-
154
-
155
-
156
-
157
-
158
-
159
-
160
-
161
-
162
-
163
-
164
-
165
-
166
-
167
-
168
-
169
-
170
 |
 |

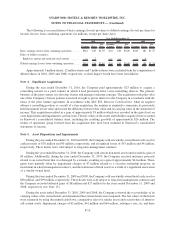
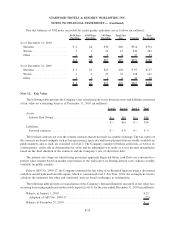
The following is a reconciliation of basic earnings (losses) per share to diluted earnings (losses) per share for
income (losses) from continuing operations (in millions, except per share data):
Earnings Shares
Per
Share
Earnings
(Losses) Shares
Per
Share Earnings Shares
Per
Share
2010 2009 2008
Year Ended December 31,
Basic earnings (losses) from continuing operations ..... $310 183 $1.70 $ (1) 180 $0.00 $249 181 $1.37
Effect of dilutive securities:
Employee options and restricted stock awards ...... — 7 — — — 4
Diluted earnings (losses) from continuing operations .... $310 190 $1.63 $ (1) 180 $0.00 $249 185 $1.34
Approximately 5 million shares, 12 million shares and 7 million shares were excluded from the computation of
diluted shares in 2010, 2009 and 2008, respectively, as their impact would have been anti-dilutive.
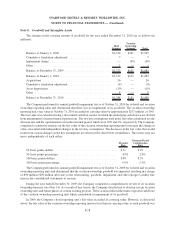
Note 4. Significant Acquisitions
During the year ended December 31, 2010, the Company paid approximately $23 million to acquire a
controlling interest in a joint venture in which it had previously held a non-controlling interest. The primary
business of the joint venture is to develop, license and manage restaurant concepts. The acquisition took place after
one of the Company’s former partners exercised its right to put its interest to the Company in accordance with the
terms of the joint venture agreement. In accordance with ASC 805, Business Combinations, when an acquirer
obtains a controlling position as a result of a step acquisition, the acquirer is required to remeasure its previously
held investment to fair value and record the difference between fair value and its carrying value in the statement of
income. This acquisition resulted in a gain of approximately $5 million which was recorded in the gain (loss) on
asset dispositions and impairments, net line item. The fair values of the assets and liabilities acquired were recorded
in Starwood’s consolidated balance sheet, including the resulting goodwill of approximately $26 million. The
results of operations going forward from the acquisition date have been included in Starwood’s consolidated
statements of income.
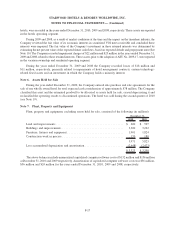
Note 5. Asset Dispositions and Impairments
During the years ended December 31, 2010 and 2009, the Company sold one wholly-owned hotel each year for
cash proceeds of $70 million and $0 million, respectively, and recognized losses of $53 million and $4 million,
respectively. These hotels were sold subject to long-term management contracts.
During the year ended December 31, 2010, the Company sold certain non-hotel assets and recorded a gain of
$4 million. Additionally, during the year ended December 31, 2010, the Company received insurance proceeds
related to an owned hotel that was damaged by a tornado, resulting in a gain of approximately $14 million. These
gains were partially offset by impairment charges of $7 million related to a vacation ownership property, an
investment in a hotel management contract, and the retirement of fixed assets as a result of a significant renovation
of a wholly-owned hotel.
During the years ended December 31, 2009 and 2008, the Company sold one wholly-owned hotel each year for
$90 million, and $99 million, respectively. These hotels were sold subject to long-term management contracts and
the Company recorded deferred gains of $8 million and $27 million for the years ended December 31, 2009 and
2008, respectively (see Note 13).
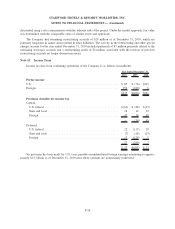
During the years ended December 31, 2010, 2009 and 2008, the Company reviewed the recoverability of its
carrying values of its owned hotels and determined that certain hotels were impaired. The fair values of the hotels
were estimated by using discounted cash flows, comparative sales for similar assets and recent letters of intent to
sell certain assets. Impairment charges of $2 million, $41 million and $64 million, relating to one, six, and three
F-16
STARWOOD HOTELS & RESORTS WORLDWIDE, INC.
NOTES TO FINANCIAL STATEMENTS — (Continued)